Session logging (deprecated)
Last updated: June 13, 2022
Note
Please note that the Session Logger application has been deprecated as of late 2021 in favor of using the NEMO laboratory management system to determine when experimental sessions have taken place (using the py:mod:~nexusLIMS.harvesters.nemo module). Maintaining the Session Logger application deployed across dozens of microscopes was not scalable, hence the change in approach. This documentation page is left as a record of prior development.
If you are deploying NexusLIMS at your institution and are interested in the session logger application, please contact the NexusLIMS authors, as the code is available upon request. The following documentation describes the operation of the Session Logger application as of mid-2020.
To accurately know what files should be included in each Experiment’s record, it is important to have a timestamp for the beginning and end of when a user has collected data. To facilitate collecting this information, a small application has been written that is run from the microscope support (or control) PC and logs basic session information to the NexusLIMS database. This document explains how this application is used, its design, what information it collects, and how it is deployed to the individual microscopes.
How to use the logger app
Using the Session Logger application is very simple. On each microscope, there will be a shortcut on the desktop that points to the application that has been stored within a local directory on the computer. At the beginning of an Experiment, double click on the following icon to start a session:
After a short delay (about 5 seconds, depending on the microscope), the application will launch and perform a number of steps (described below), resulting in a display informing the user that a session has been started:
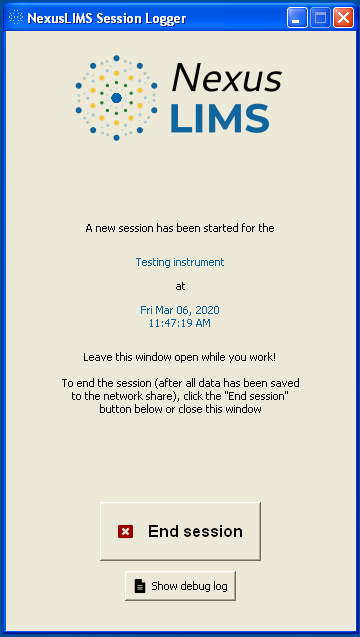
Once this screen is displayed, the user should simply keep the window open while they work (it can be minimized with no problem). The logger does not perform any actions during this stage, and is simply waiting for the user to click the “End Session” button.
Once the user has finished collecting data, they should click the large “End Session” button in the application. This will trigger the application to mark the current Experiment as finished in the database, and the logger application will close itself after a short delay.
What if something goes wrong?
In the unlikely event that the logger application encounters an unexpected condition in the database or other error, it will inform the user and pop-up a debugging log with more information (this log can also always be accessed by clicking the “Show debug log” button on the main screen):
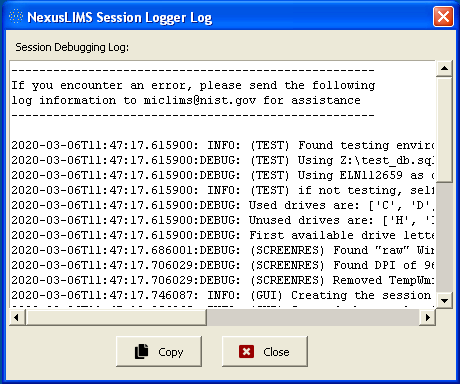
If this log window appears on its own (which it shouldn’t), we ask that that you click the “Copy” button to copy all the text to the clipboard and send it to the facility managers so they can attempt to resolve the issue.
Interrupted sessions
The session logger application does it’s best to ensure that if the window is closed by any means, it sends an “End Session” log to the database. There is an option to “Pause Session” however, which is prompted if the regular “Close window” button is clicked:
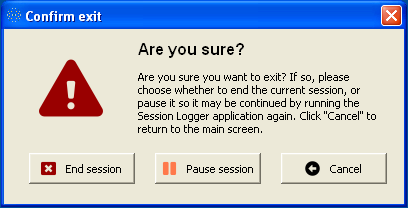
Clicking “Pause session” will immediately close the application without sending any further information to the database, and should only be done if the user plans to resume the session before another user will use the instrument (e.g. they need to restart the computer for some reason). Pausing the session will leave the database in an inconsistent state, which will be detected the next time the logger application is run. If this is the case, the user will be prompted to confirm whether they want to continue the existing session, or start a new one:
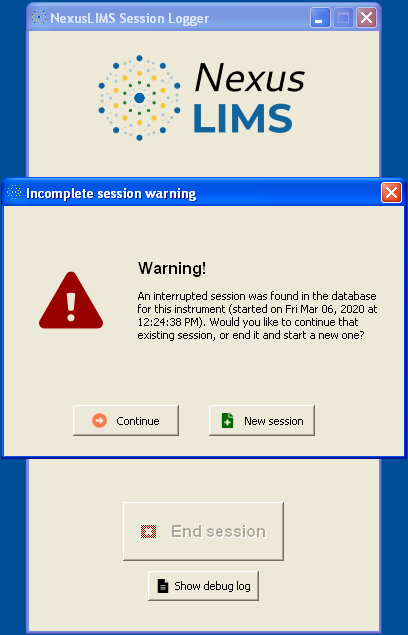
This dialog will also appear when the user clicks on the desktop shortcut in the event the computer crashed for some reason and the application was forcibly closed. Clicking “Continue” will cause the application to use the existing session (found in the database), while clicking “New session” will end the session that was found and start a new one.
Actions performed by the logger
The NexusLIMS Session Logger performs a number of steps to record that an Experiment has occurred, and keeps the progress bar up to date while it is operating. These steps are detailed below.
2. Getting the instrument name
Using the database file on the mounted drive, the logger application queries
the instruments table in the database using the “hostname” of the current
computer. In this way, a computer name (such as ***REMOVED***) gets mapped
to an instrument persistent identifier (PID) (such as FEI-Titan-TEM-635816)
and this value is stored for later use.
3. Checking instrument status
Before logging the start of a new Experiment, first the logger application
checks to ensure that the most recent entry logged for this instrument was
an 'END' entry, meaning that the last session was marked as finished.
For example, the code runs a query such as the following to get the most
recent entry (that was not a record generation event):
SELECT event_type, session_identifier, id_session_log, timestamp
FROM session_log WHERE instrument = 'FEI-Titan-TEM-635816'
AND NOT event_type = 'RECORD_GENERATION'
ORDER BY timestamp DESC LIMIT 1;
If this most recent entry is an 'END', the database is in its expected
normal state, and the application continues on as normal. If it is instead a
'START' entry, then the application asks the user
whether they want to continue the existing session found in the database, or
start a new one (see the interrupted session section for more
details). If the user chooses to continue the existing session, the logger
application notes the session identifier from the database for that session and
jumps to step 6.
4. Inserting a START log
With the instrument PID known and a randomly generated identifier string, the
logger runs a database insertion query on the session_log table to record
that a session has been started. While not explicitly specified in the query,
the current timestamp is also included in the insertion. As an example:
INSERT INTO session_log (instrument, event_type,
                         session_identifier, user)
VALUES ('FEI-Titan-TEM-635816', 'START',
        'c9b774c9-4a59-4154-af05-0e2477e57cc4', 'local_user');
After this has finished, the logger runs another query to verify that the row was inserted into the database as expected, and raises an error if not.
6. Ending the session
Once the user clicks the “End session” button, the logger application again
mounts the network share (as in step 1) so it can communicate with
the NexusLIMS database. Using the same session identifier
value as before, the application inserts a corresponding 'END' log into the
database using a query very similar to that in step 4.
After verifying that this record was inserted correctly, the application
then updates the status of both the 'START' and 'END' logs for this
session from 'WAITING_FOR_END' to 'TO_BE_BUILT'. This status indicates
to the record builder that it should go ahead to
actually build and upload the record for this Experiment.
7. Cleaning up
After updating the logs in the previous step, the logger application unmounts the network share (as before), and if everything went according to plan, waits three seconds and then shuts itself down. At this point, it is ready to be run again by the next user that arrives to begin a new session.
Information collected
As described above and in the database documentation, the logger application collects the bare minimum amount of information required to compile an Experiment’s record. The values collected from the microscope computer that are recorded to the database with each log are:
Variable |
Description |
|---|---|
|
A random UUID4 (36-character string) that
is consistent among the record’s
record’s |
|
The instrument PID associated with this microscope’s computer |
|
The current date and time (in local time) |
|
The type of log for this session (either
|
|
The status of the record
associated with this session.
Its value is |
|
The username of the currently logged in user
(often this is just |
Logger implementation and deployment
As data security is of the utmost importance in NexusLIMS, the developers felt it prudent to describe in detail the specific implementation that was used to produce the session logger application that runs on the microscope PCs (since these machines control critical instrumentation).
The logger application is implemented in two files: db_logger_gui.py (that
contains the interactive GUI parts of the code) and make_db_entry.py (that
contains the database communication and logic code).
The application is written using 32-bit Python 3.4.4 (in order to support
computers back to Windows XP) and is compiled to a single .exe file using the
PyInstaller package for simple deployment. The executable is built by using
the db_logger_gui.spec file and running:
pyinstaller.exe db_logger_gui.spec
The logger application is compiled to NexusLIMS Session Logger.exe, and this
file is then copied to the centralized file storage at
//network/path/to/mmfnexus/folder/NexusLIMS/NexusLIMS Session Logger.exe,
where it is then pulled down to the individual microscope PCs by the startup
batch script that is used to mount the centralized file storage. Each Nexus
microscope has a desktop shortcut that points to this copied file, so users are
able to launch the latest version of the logger application each time they
click the icon.
The application runs as a
portable executable,
meaning it does not get “installed” onto the computer running it in the
traditional sense, and leaves nothing behind in the Windows registry or on the
filesystem. It also runs without administrator privileges. The app extracts a
minimal Python runtime to a temporary folder, which is removed when the
application is closed (on Windows XP machines, this is usually in the
C:\Documents and Settings\<username>\Local Settings\Temp\_MEI#####
folder, where ##### is a random number). This step is the reason for
the small delay when first starting the logger.
The session logging app is written mostly using “pure” Python (meaning it primarily utilizes built-in modules). The GUI portions are written using the TkInter library, while the database communication uses the sqlite3 library. A few Windows-specific parts of the code are used to find an unused drive letter to mount the central file network share using the ctypes module.
System calls
While most of the logger application’s logic is implemented in the Python code, a few operations require interfacing directly with the microscope computer via Windows command line operations. These commands are run using the subprocess module, and are explained here so Nexus microscope operators have a reference for every command that is run on their machines:
The first two system calls are used by the GUI code (
db_logger_gui.py) and query the local system to get the current monitor resolution and display DPI, so the logger application can be reliably placed in the center of the screen:wmic path Win32_VideoController get CurrentHorizontalResolution, CurrentVerticalResolution
This command uses the Windows Management Instrumentation command-line (WMIC) utility (in read-only mode) to get the current screen width and height in pixels. The next command is:
reg query "HKCU\Control Panel\Desktop\WindowMetrics" /v AppliedDPI
This command queries (again, read-only) the Windows registry to get the display “scaling factor”, which affects how wide windows are by default. The output of these last two commands is used to calculate the correct placement to ensure the GUI window opens in the center of the screen.
The next system call is used by the database communication module (
make_db_entry.py) to get the IP address of the central file system where the database file is stored (//network.host.for.file.storage/), since mounting via IP is more reliable than using the host name. The command used for this is:ping network.host.for.file.storage -n 1
This command will send a single ping to the server and resolve the host name to an IP address. The output of the command is parsed to find the IP that should be used to mount the network location.
Next, the
make_db_entry.pymodule runs:net use
to list the currently mounted network drives. If the required network location (
//network.host.for.file.storage/nexusLIMS) is already mounted, that drive path is used rather than mounting another copy. If it is not, the path will be mounted using a command:net use H: \\network.host.for.file.storage\nexusLIMS
The drive letter (in this example
H:) is automatically determined by finding a currently unused drive letter earlier in the code.Finally, when the database operations have finished, the code runs one final system call:
net use H: /del /y
which simply unmounts the network drive that was used earlier to connect to the database.
Application dependencies
The third-party dependencies used by the logger application are:
Package |
Version |
Notes |
|---|---|---|
3.4.2 |
Primary dependency Used to ensure that only one copy of the logger application can be run at one time (when running as a compiled .exe) |
|
3.5 |
Primary dependency Used to compile the python modules
|
|
1.7.0 |
Primary dependency Used to access the system clipboard to allow users to copy the debugging log to a file in the case of error |
|
0.2.15 |
Primary dependency Used to ensure only one version of the
application can be run when running
directly as a Python module, rather than
as an .exe ( |
|
0.16.1 |
Secondary dependency A graph library installed as a dependency
of |
|
2019.4.18 |
Secondary dependency A library for creating portable
executable files, installed as a
dependency of |
|
0.18.2 |
Secondary dependency A Python 2/3 compatibility layer
installed as a dependency of |
|
0.2.0 |
Secondary dependency A re-implementation of |
|
18.2 |
Secondary dependency A Python project packaging library,
installed as a dependency of
|
|
5.4.4 |
Secondary dependency Another Python packaging library,
installed as a dependency of |
|
7.1.2 |
Secondary dependency The Python Package Installer, used to
install the other packages and as a
dependency of |
|
1.13.0 |
Secondary dependency A Python 2/3 compatibility library
installed as a dependency of |