Both a laboratory and a house, the two-story, four bedrooms, three-bath NZERTF would blend in nicely in a new suburban subdivision. It was designed and built to be approximately 60 percent more energy efficient than homes built to meet the requirements of the 2012 International Energy Conservation Code. During the first year of operation (July 2013 – June 2014) the house exceeded its goal with enough surplus energy to power an electric car for about 1400 miles. Instead of paying almost $4,400 for electricity – the estimated annual bill for a comparable home in Maryland – the virtual family of four residing in the all-electric home actually exported energy to the electric grid. Additional details can be found by reading “NIST Test House Exceeds Goal; Ends Year with Energy to Spare”.
Validate environmental impact of a new product
When NIST publicly launched the Net-Zero data set at the TechCrunch hackathon in San Francisco, a number of teams working on energy efficient product development found this data set to be useful in validating the energy impact of a new product. The team from smart fenestra is building a device which turns conventional windows into smart windows and allows them to open and close based on environmental factors. They used the Net-Zero data set to develop an algorithm that estimates the energy that would be saved if their new smart window opened and closed windows at the optimal time, based on interior and exterior temperature and air quality.
Read more about smart fenestra's use of Net-Zero data here.
If you would like your Net-Zero research featured on this website, contact Bill Healy.
This section provides some examples of ways that the data from the Net-Zero Energy Residential Test Facility could be used.
With the large amount of data available, it would be valuable to develop clever means of displaying the data to help assess operational trends. For example, the image below is a contour plot of the temperatures on the first floor overlaid on a floor plan obtained from the design drawings at https://www.nist.gov/el/net-zero-energy-residential-test-facility. Running through images like these might help one to better understand thermal comfort throughout the house.
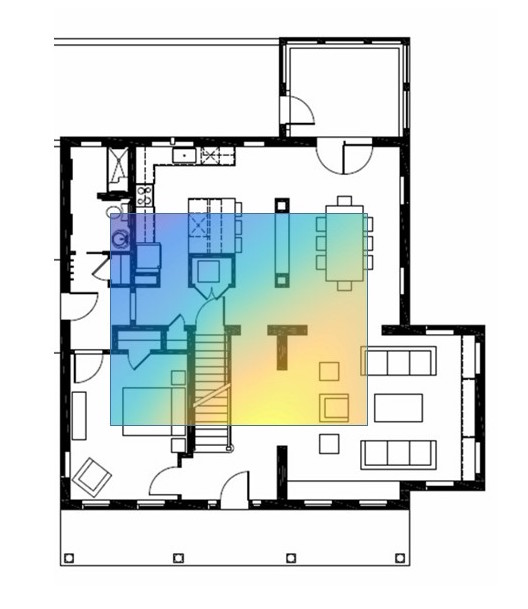
This image is for one point in time (July 7, 2015, 5:00 pm) and uses the room temperature readings in the “IndEnv” subsystem. The data values that were used include:
IndEnv_RoomTempBA1Temp
IndEnv_RoomTempBR4Temp
IndEnv_RoomTempDRTemp
IndEnv_RoomTempHallLowerMidTemp
IndEnv_RoomTempKitchenTemp
IndEnv_RoomTempLRTemp
Finding ways to present home performance data in a clear manner will help homeowners and building professionals better understand how systems are operating and can help identify potential areas for improvements.
The data can be used to determine the efficiency of equipment under a range of conditions. As one example, consider the photovoltaic system. The efficiency of the array is the DC electrical output divided by the incident energy on the array. There is also an inverter in the system that converts the DC energy from the array to AC electrical energy for use by the home. An efficiency can also be determined for the inverter as the AC electrical energy output divided by the DC electrical energy input. For this example, we will examine how these efficiencies vary throughout the day and as a function of incident sunlight.
The pertinent data for the photovoltaic system can be found in the “PV” dataset. We will consider the power output for each minute.
Determination of power output from PV array:
The array is made up of four strings of modules. The total power from the array is the sum of the power from the four strings. The power generated by each string can be determined by multiplying the current by the voltage. Note that strings 1&2 and 3&4 are each wired in parallel to a separate inverter so that the voltage across string 2 is the same as that across string 1, and the voltage across string 4 is the same as that across string 3. The power for each string can be determined from the database variables as:
Power_String1 = PV_StringCurrentIStr1 * PV_StringVoltageUStr2
Power_String2 = PV_StringCurrentIStr2* PV_StringVoltageUStr2
Power_String3 = PV_StringCurrentIStr3* PV_StringVoltageUStr4
Power_String4 = PV_StringCurrentIStr4* PV_StringVoltageUStr4

Power_Array = Power_String1 + Power_String2 + Power_String3 + Power_String4
Determination of power output from inverters:
The total AC power output from the inverters can be determined from the dataset using the following variables:
Power_Inverter = PV_PVSystem1ACPowerOSPACPV1OS + PV_PVSystem2ACPowerOSPACPV2OS
Determination of solar insolation:
The data set contains a field that provides the amount of energy impacting the array in the last minute. To obtain an estimate of the average power over that minute in kW:
Sun_AvgPower = PV_PVInsolationHArray (kWh) / (1/60 h)This number will not be perfectly aligned in time with the power readings, which are taken on the minute, but they can be used as an approximation of the power level on the minute.
Determination of efficiencies:
The efficiency of the array at any minute can then be determined by dividing the Power_Array by the Sun_AvgPower, making sure that each variable has consistent units.
The efficiency of the inverter can be determined as the Power_Inverter divided by the Power_Array .
This spreadsheet (download here) shows sample calculations for July 2015 and plots the efficiency levels against solar insolation.
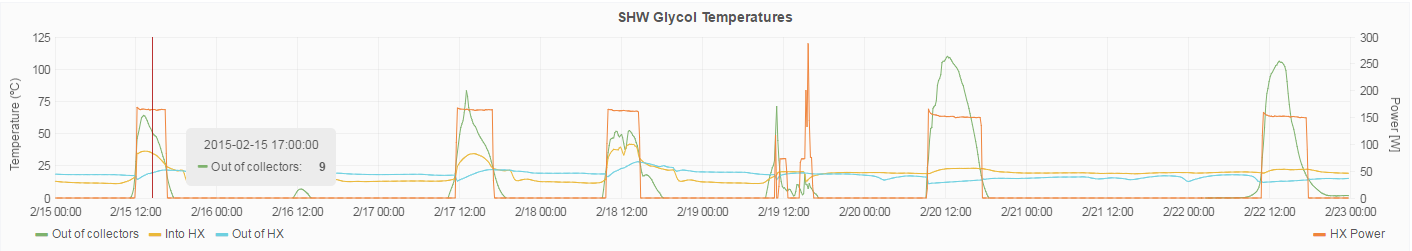
As noted in the "Known Data Gaps and Issues" section of the website, there are a number of times during the year where particular equipment was not working as designed. These times could give an opportunity to develop and test automated fault detection and diagnosis algorithms for residential buildings. For example, the solar water heater was not working properly from February 19 through March 22. Can you determine what is wrong from the data, keeping in mind that operation of the solar water heater is dependent upon the amount of sunlight, snow cover on the panels, and hot water usage? A plot of the glycol temperatures and solar pump power versus time, for example, could be useful.
Other equipment that didn't work as planned during the year include the heat pump (due to a faulty relay) and the photovoltaics (due to snow cover).