NIST Engineering Lab’s Net-Zero Energy Residential Test Facility data captures diverse measurements from a high precision lab home that produces as much energy over the course of a year as it uses. It is an extraordinary facility that has sensors and instrumentation on nearly every facet, from energy consumption to comfort. This high resolution, high precision data has allowed NIST and researchers in the home energy and sustainability field to investigate the performance of efficient homes and have formed a basis for conducting home efficiency simulations that allow engineers to better understand how to construct better, energy efficient homes. There are nearly 400 channels of data across 11 subsystems. That means 400 opportunities to find meaningful energy use patterns and create prototypes of home energy monitoring tools and analytics.
This data is open and free. Help us track and preserve net-zero's impact and value through citation:
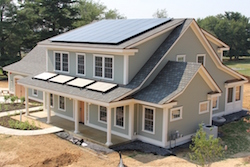
In 2012, the National Institute of Standards and Technology (NIST) completed construction of the Net-Zero Energy Residential Test Facility, a testbed designed as a single family house to develop measurement science for assessing equipment and strategies for achieving energy efficient homes with good indoor environmental quality (Pettit et al. 2014). After extensive instrumentation and planning, NIST began a one-year test period on July 1, 2013 to assess whether the building could achieve net-zero operation, meaning that the amount of energy consumed by the home over the course of a year would be less than that generated by the photovoltaic (PV) system located on the roof of the facility. The house was operated in an all-electric configuration with a simulated family of four that carried out all activities that would be expected in a typical American household.
NIST, in conjunction with the U.S. Department of Commerce Data Service, is making available data from the operation of the facility during these test phases. The purpose of this document is to describe the configuration of the house along with the contents of each data channel that is reported.
Data were recorded on a minutely basis from a range of sensors that monitored electricity usage, equipment performance, indoor conditions, and outdoor conditions. Data indicate whether or not loads are activated and the amount of heat that those loads are introducing into the space. While every effort has been made to minimize disruptions in data flow, there were times during the test phase when data are not available or particular subsystems within the house are not operating properly. A log of such instances are maintained on the website where the data can be accessed.
For a complete list of variables in the dataset please download the Metadata CSV file. The Metadata CSV also includes information on the subsystem and where possible: the measurement location, units for measurement, and the min/max values.
During the one-year test phase of the Net-Zero Energy Residential Test Facility (NZERTF) from July 1, 2013 through June 30, 2014, NIST is aware of several data gaps or operational anomalies that are reflected in the dataset. When data are missing, the data files presented here replace those missing data values with the symbol “NA.” One of the more notable issues occurred between August 2 and 6 when the data acquisition system was not operational and all data are missing. The most common time for missing data falls at the beginning of each day when the data acquisition system was going through a reset that would often last several minutes. Additionally, sensors would occasionally stop working and present erroneous readings. These readings often resulted in a zero value; such readings have not been removed from the data sets. Users should be mindful to be aware of such possibilities.
The table provided here lists the known issues by the main subsystems: General, Solar, Ventilation, Indoor Air Quality (IAQ), Heat Pump, and Domestic Hot Water (DHW). For a complete listing please download the complete Log. Some of the key issues are as follows:
| Data are missing on account of a data acquisition system problem from August 2 through August 6 |
| The glycol circulating pump for the solar water heating system was not operational from August 24 through September 3 |
| The compressor of the heat pump water heater was not operational from November 25 through December 5 because of a wiring issue on the controller |
| Gaithersburg received a larger amount of snowfall than normal during this period; the log shows days when the solar panels were covered with snow |
| The wind sensor gave many errors during the year-long period |
| Adjustments were made throughout the test year to the loads to account for defective loads or to better allocate energy consumption of plug loads. |
| Sampling of volatile organic compounds took place throughout the year. During those times, the blower for the heat pump unit was set to “On” from “Auto” to better mix the air in the house. |
| Replumbing of the piping between the solar water heater and heat pump water heater was done in August to shorten the length of piping between those two tanks. |
During the one-year test phase of the Net-Zero Energy Residential Test Facility (NZERTF) from February 1, 2015 through January 31, 2016, NIST is aware of several data gaps or operational anomalies that are reflected in the dataset. When data are missing, the data files presented here replace those missing data values with the symbol “NA.” The most common time for missing data falls at the beginning of each day when the data acquisition system was going through a reset that would often last several minutes. Additionally, sensors would occasionally stop working and present erroneous readings. These readings often resulted in a zero value; such readings have not been removed from the data sets. Users should be mindful to be aware of such possibilities.
The table provided here lists the known issues by the main subsystems: General, Solar, Ventilation, Indoor Air Quality (IAQ), Heat Pump, and Domestic Hot Water (DHW). For a complete listing please download the complete Log. Some of the key issues are as follows:
| There were several occasions where sampling of the indoor air quality was taking place. Those instances are noted in the IAQ column. |
| At the beginning of the year-long data collection period, some short term tests were conducted to evaluate the flow measurement in the Heat Recovery Ventilator and to assess the transient response of the facility. These dates are noted in the General, Ventilation, and Heat Pump columns. |
| Snow cover of the solar panels is recorded in the General and Solar PV Comments column. |
| An incorrect setting of a valve on the solar thermal water heating system starting on February 19, 2015 and ending on March 17, 2015 caused a long stretch of operation without that system operational. |
| The heat pump unit was not working for approximately two days starting on May 30, 2015 due to the failure of a relay on the outdoor unit. |
| Approximately three days of data are missing starting on October 20, 2015 on account of a problem with the data acquisition and control system. |
DHW: Domestic Hot Water – system to make and deliver hot water in the facility, including flow rates and temperature of those end uses. Also describes the back-up water heater and the use of cold water.
SHW: Solar Hot Water – solar water heating system.
HVAC: Space Heating and Cooling System (the “V” stands for ventilation, but that function has its own subsystem).
Load: Electrical and Thermal Loads that simulate the presence and actions of the virtual occupants in the home.
IndEnv: Indoor Environment – Measurement system that captures temperatures and relative humidities throughout the home.
PV: Photovoltaic system, including the array and inverters.
OutEnv: Outdoor Environment – Measurement system that captures ambient temperature, solar radiation, and wind conditions at the NZERTF.
Vent: Ventilation – system to deliver outdoor air into the house and to simultaneously exhaust stale indoor air from the home.
Elec: Electrical – system to monitor each electrical circuit in the home.
Temperatures and relative humidity in different rooms of the house.
Temperature, wind conditions, and solar insolation on the main roof and porch roof of the house.
Electrical power and accumulated energy over the course of the day for each circuit in the house. Circuits have been arranged so energy consumption by particular devices can be easily identified.
Temperatures in and out of the heat pump unit and heat recovery ventilator.
Flags that indicate what appliance, plug load, faucet, or virtual occupant is active at any minute of the day.
Temperatures of water at fixtures and the water heaters.
Flow rate and cumulative water consumption at particular fixtures.
Energy production of the photovoltaic system.
Healy, William, A. Hunter Fanney, Brian Dougherty, W. Vance Payne, Tania Ullah, Lisa Ng, and Farhad Omar. “Net Zero Energy Residential Test Facility Instrumented Data; Year 2,” January 2017. doi: https://doi.org/10.18434/T46W2X
Healy, William, Tzong Hao Chen, Brian Dougherty, A. Hunter Fanney, Tania Ullah, W. Vance Payne, Lisa Ng, and Farhad Omar. “Net Zero Energy Residential Test Facility Instrumented Data; Year 1,” October 2018. doi: https://doi.org/10.18434/T4/1503134