7 Michigan State Police
The results of Section 7 are based on searches of the sequestered dataset Michigan State Police. This dataset consist of of 2 174 operational latent probes. No EFS data was provided for probes or mated exemplars.
All probes searched were a single friction ridge sample from somewhere on the hand. Because the ELFT API indicates to implementations whether an image comes from the distal or palm region, analysis is separated between the two.
Note: While NIST biometric technology evaluations typically use sequestered law enforcement data, a literature search indicates that this collection of data may have been supplied to other research organizations that are not subject to the same strict sequestration policies as NIST.
7.1 Failures
Table 7.1 shows the number of failures to create templates. Table 7.2 shows the number of failures to produce a candidate list.
| Image Type | Content | Distal Failures | Palm Failures | Attempts |
|---|---|---|---|---|
| Exemplar | Image | 0 | 0 | 1 365 |
| Probe | Image | 47 | 6 | 2 174 |
| Probe Content | Distal Failures | Palm Failures | Attempts |
|---|---|---|---|
| Image | 112 | 8 | 2 174 |
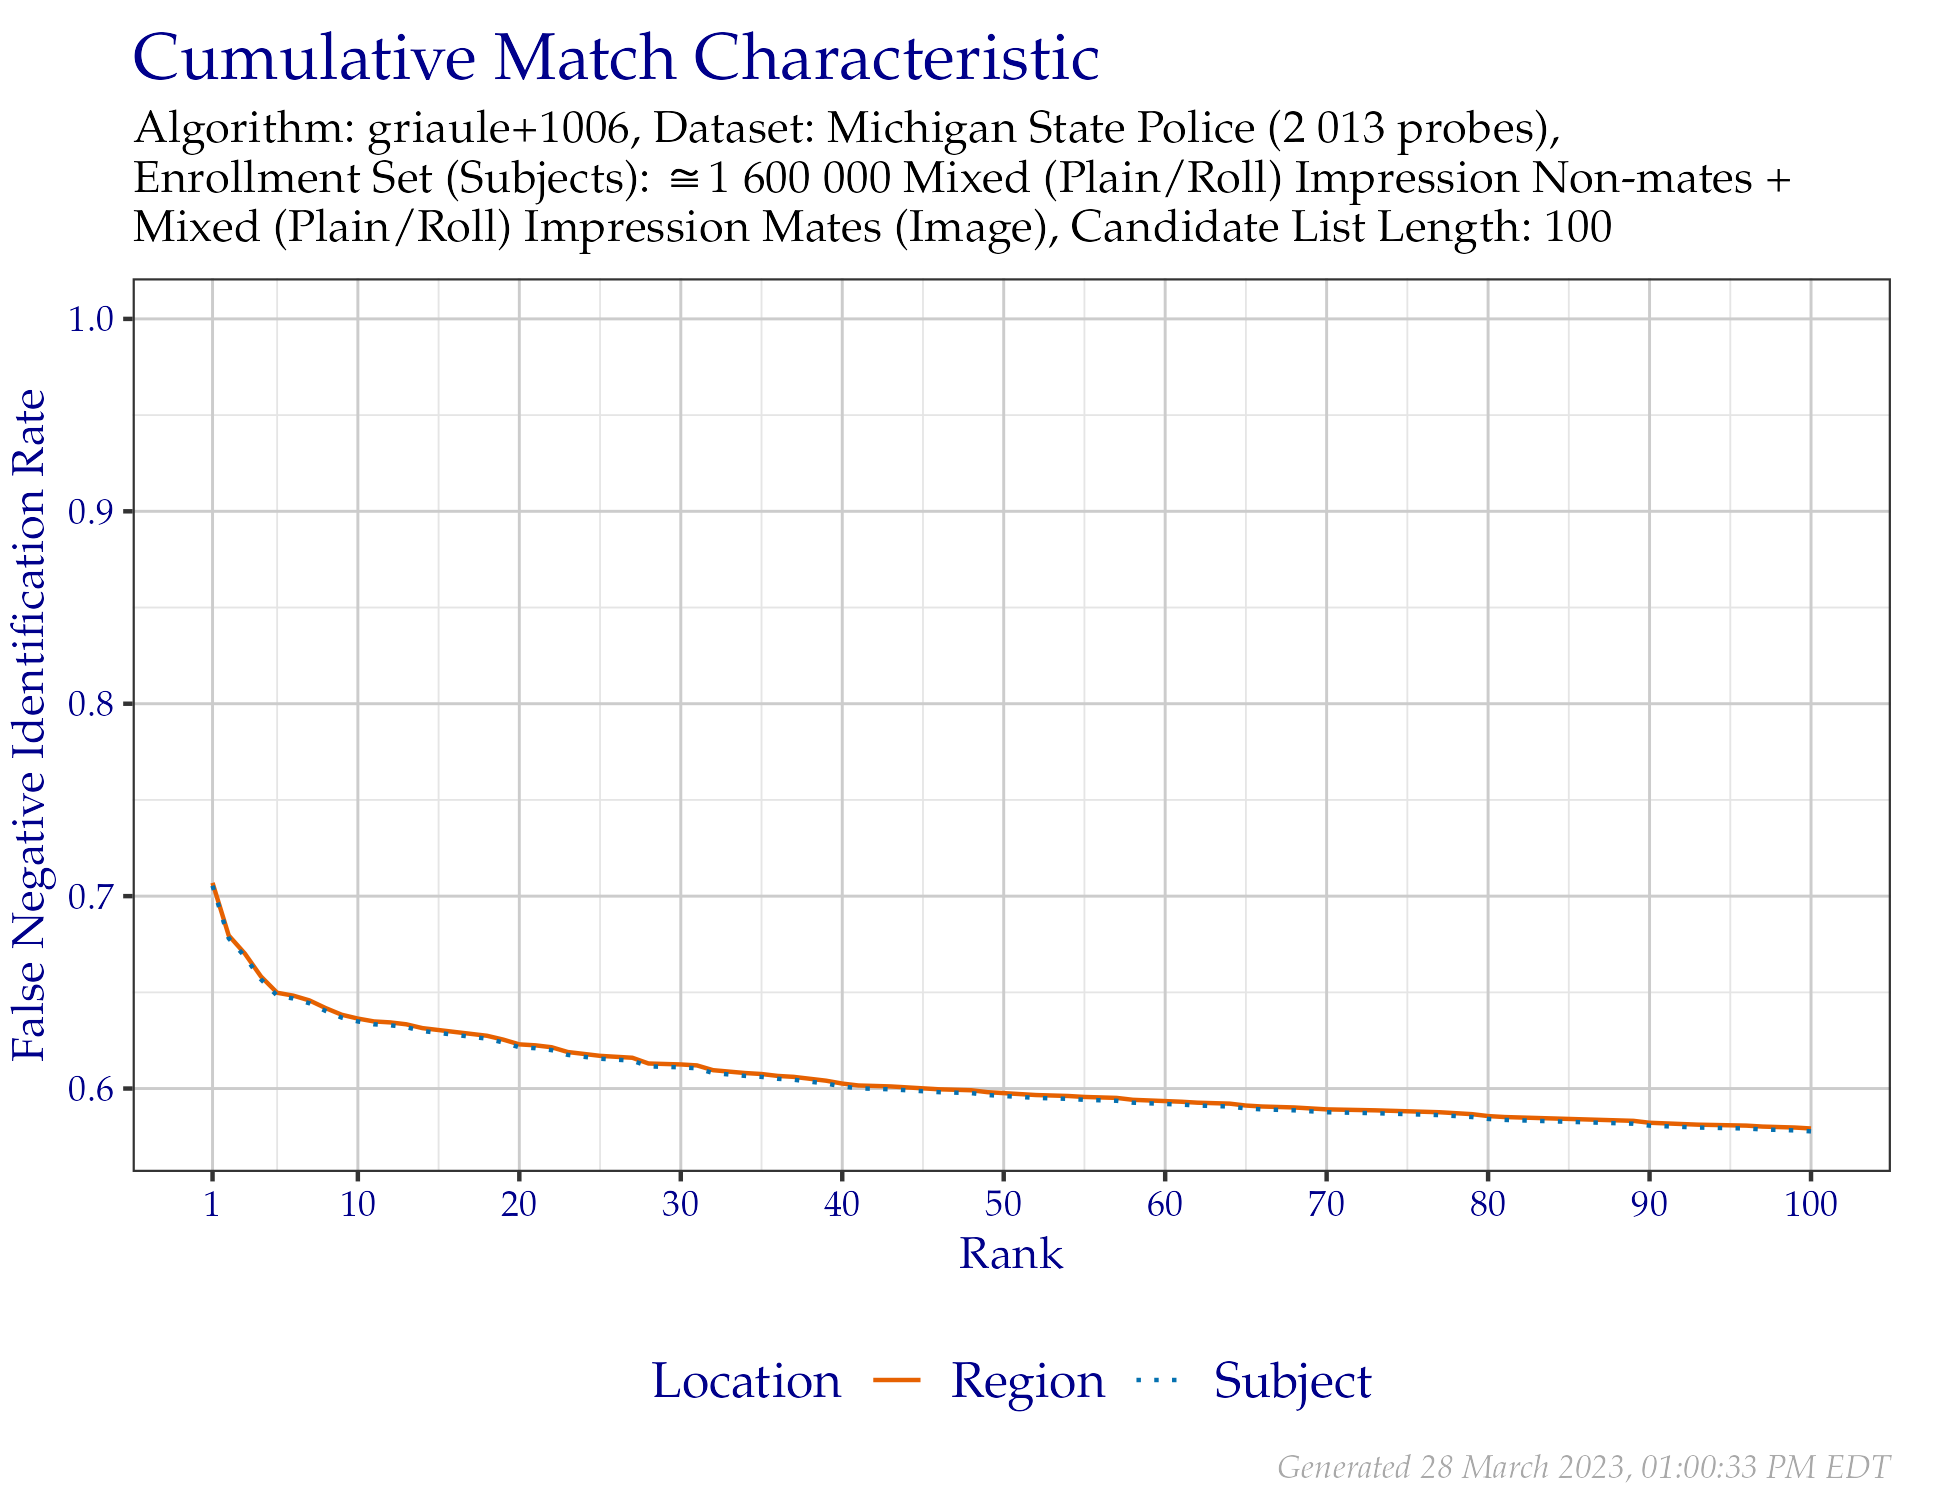
7.2 Distal Region CMC
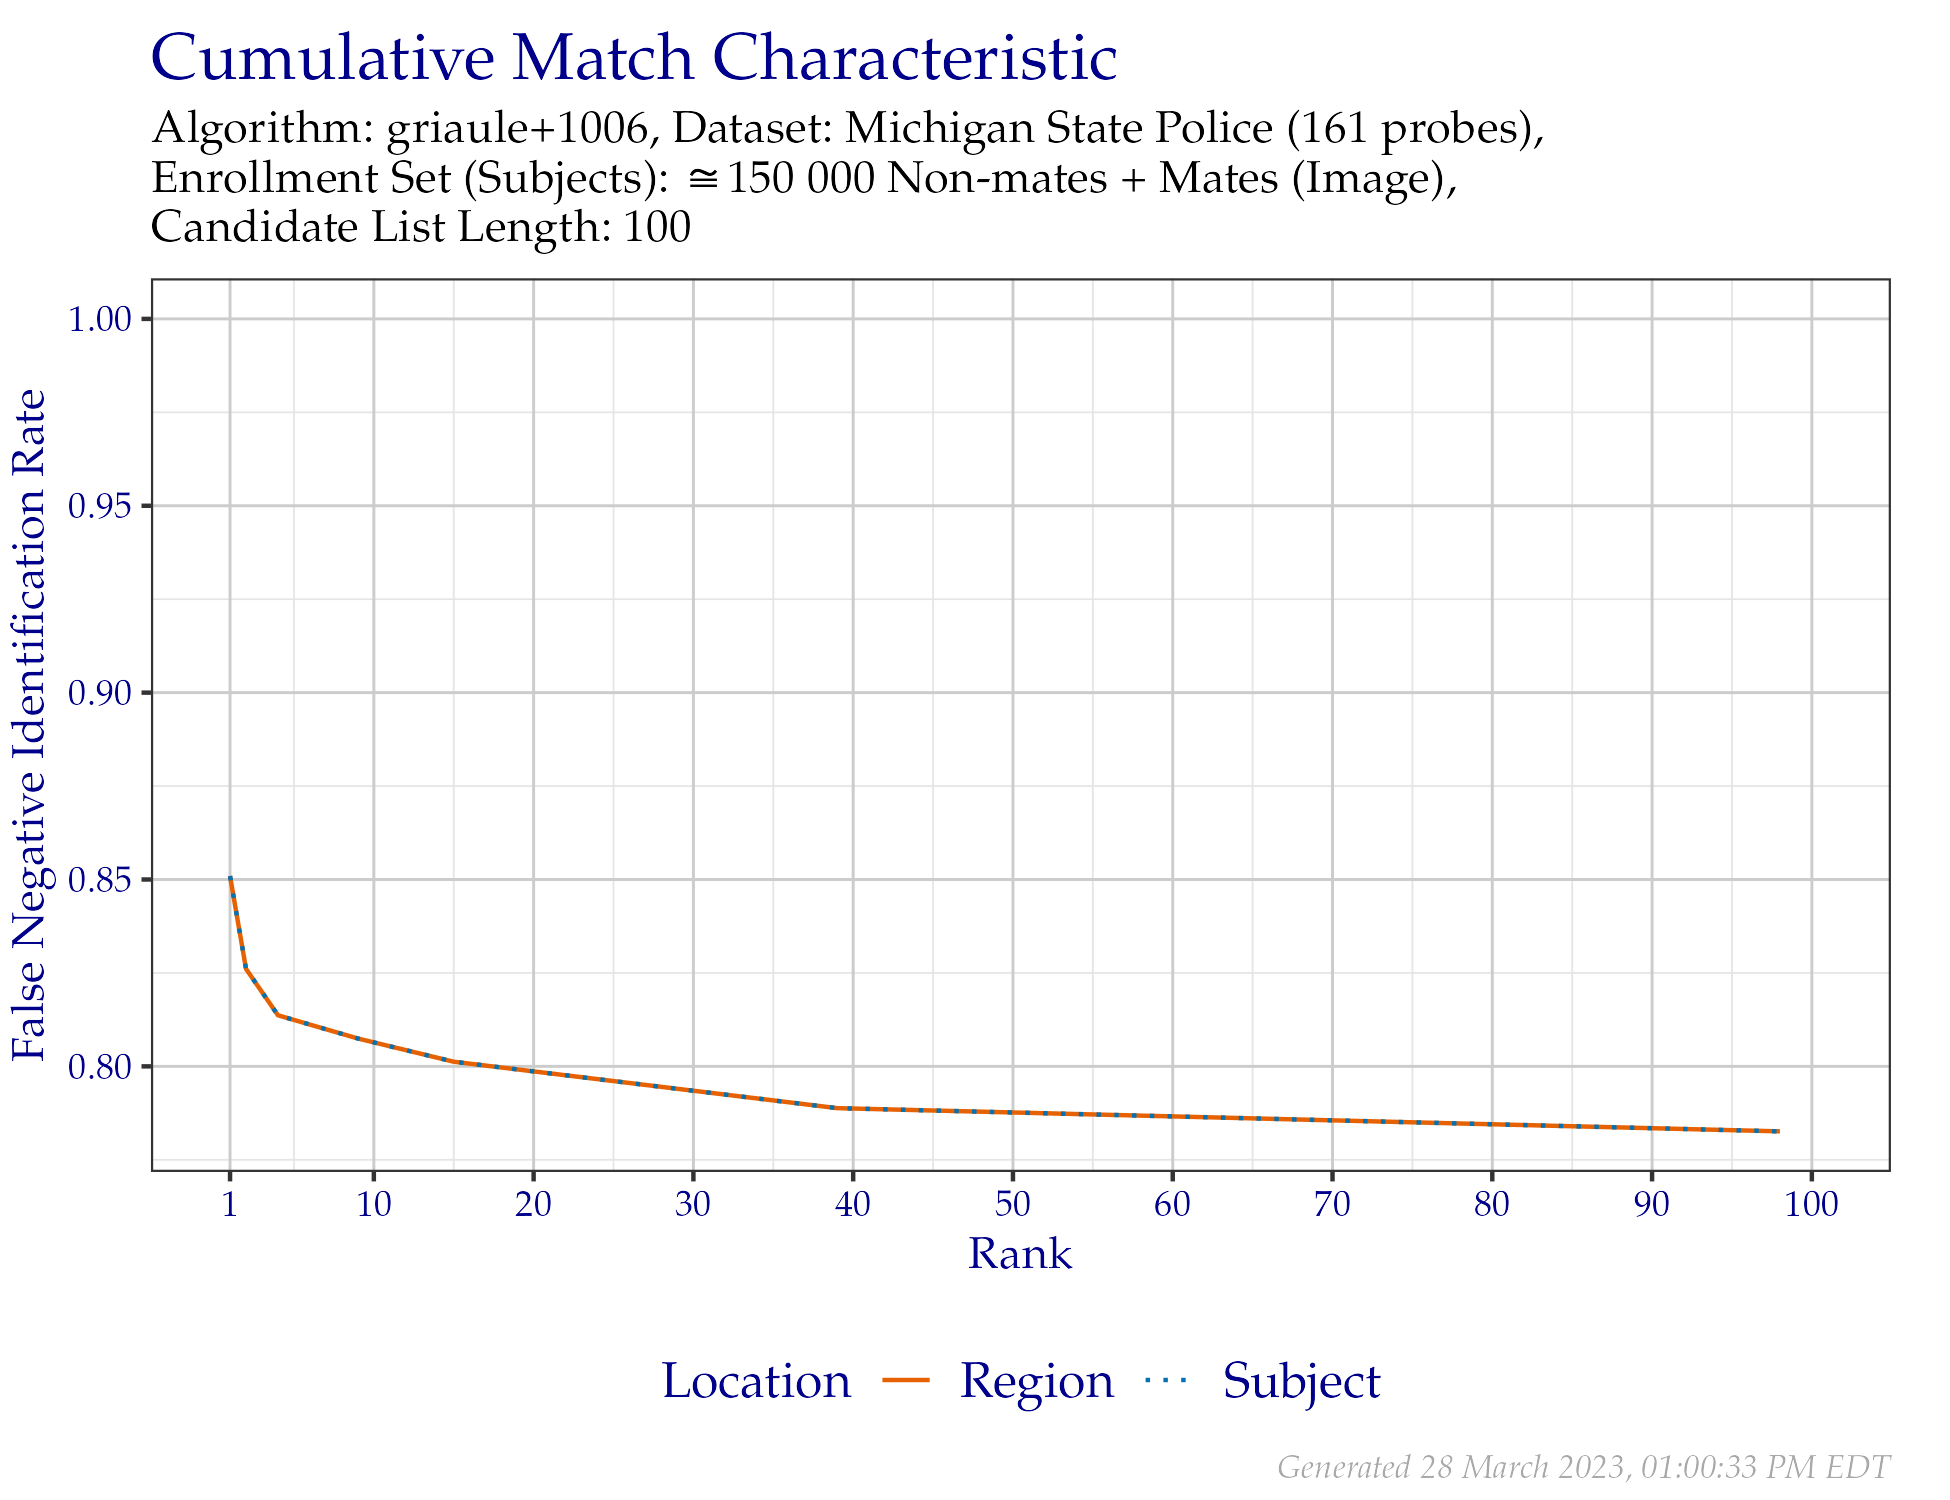
7.3 Palm Region CMC
7.4 Distal Region DET
7.4.1 Plots
The DET in Figure 7.3 shows results from only the distal phalanx probes from Michigan State Police. Annotated values indicate similarity scores, which are tabulated in Table 7.6.
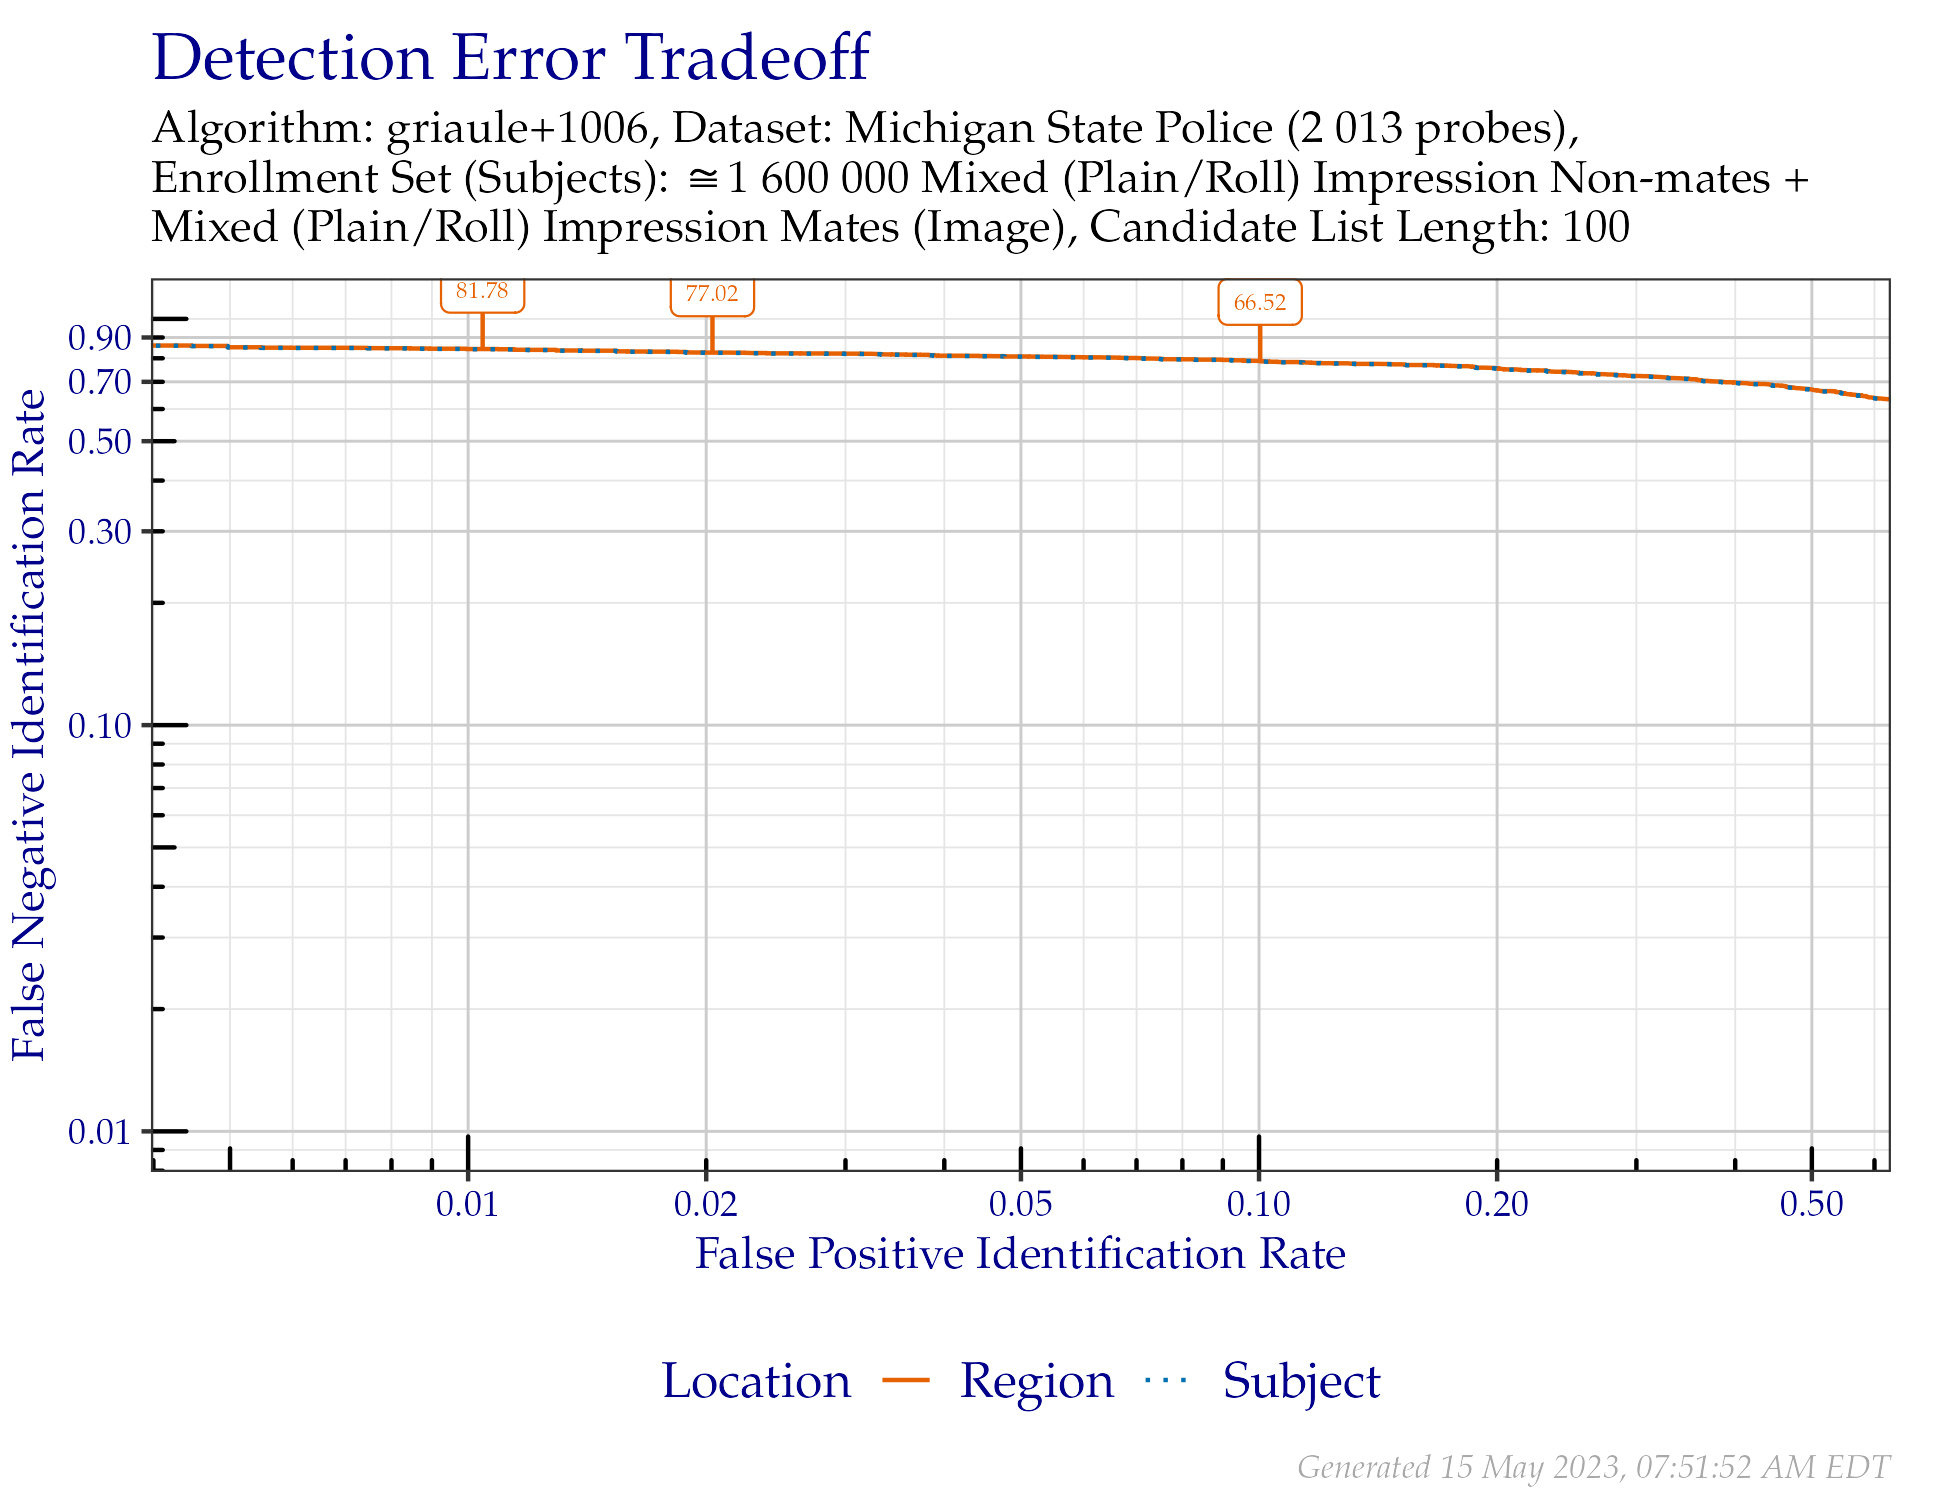
Figure 7.3: DET when searching Michigan State Police distal phalanx probes. Annotated values indicate similarity scores.
7.4.2 FNIR at Select FPIR
The values in Table 7.5 correspond to Figure 7.3.
| Probe Content | FPIR = 0.01 | FPIR = 0.02 | FPIR = 0.1 |
|---|---|---|---|
| Image | 0.843 | 0.8261 | 0.7869 |
7.4.3 Similarity Score Thresholds at Select FPIR
The values in Table 7.6 correspond to similarity score thresholds observed at the select FPIR values from Table 7.5.
| Probe Content | FPIR = 0.01 | FPIR = 0.02 | FPIR = 0.1 |
|---|---|---|---|
| Image | 81.78 | 77.02 | 66.52 |
7.5 Palm Region DET
7.5.1 Plots
The DET in Figure 7.4 shows results from only the palm probes from Michigan State Police. Annotated values indicate similarity scores, which are tabulated in Table 7.8.
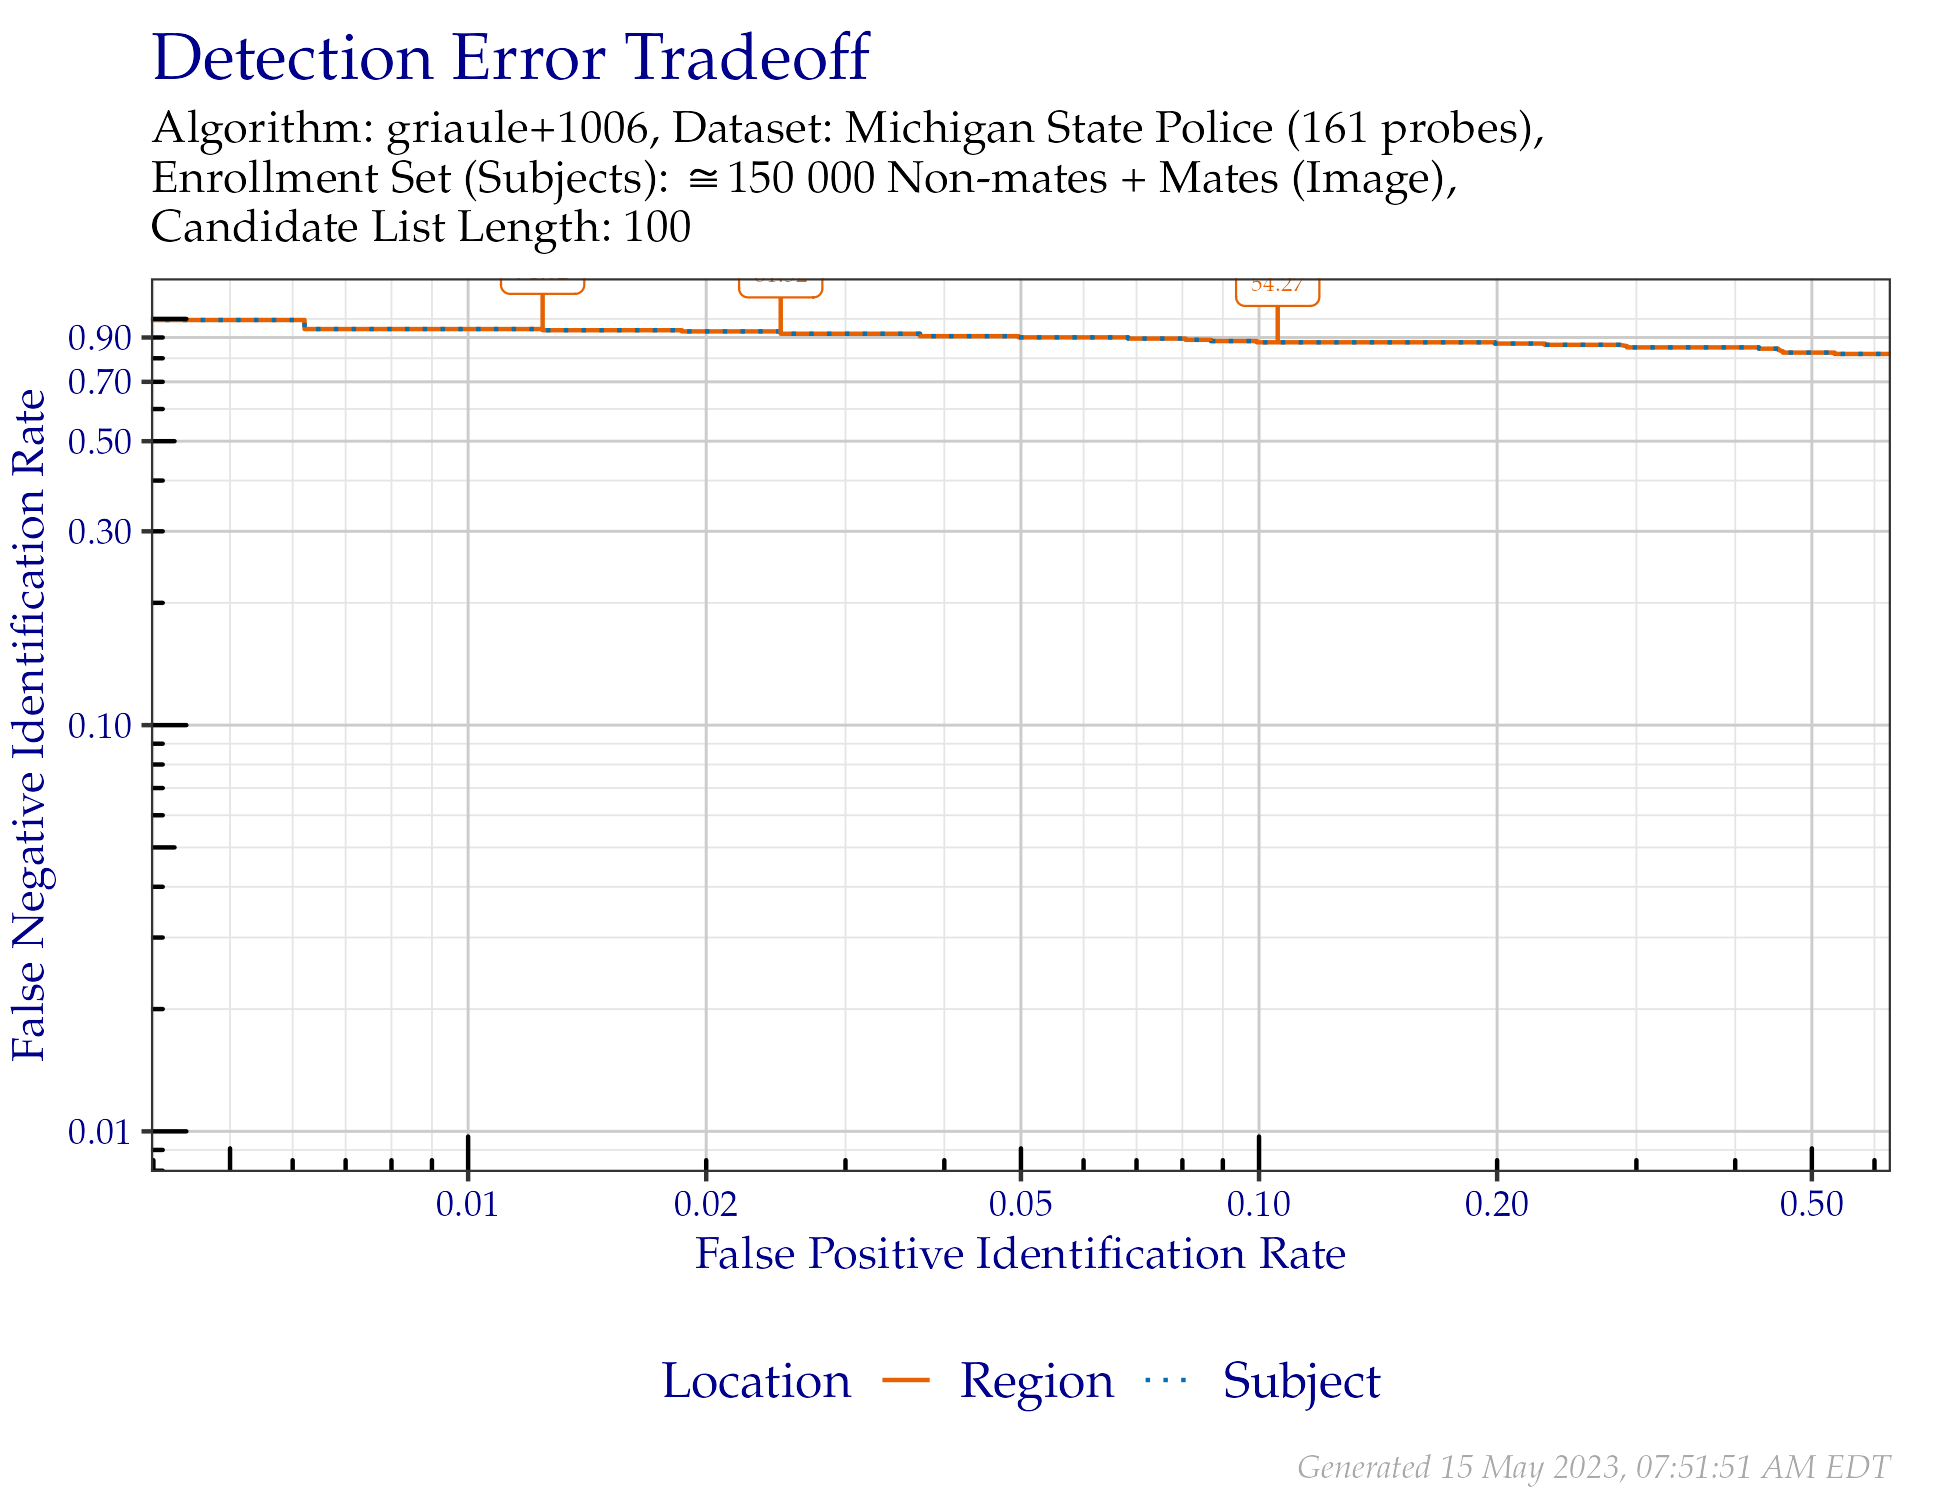
Figure 7.4: DET when searching Michigan State Police palm probes. Annotated values indicate similarity scores.
7.5.2 FNIR at Select FPIR
The values in Table 7.7 correspond to Figure 7.4.
| Probe Content | FPIR = 0.01 | FPIR = 0.02 | FPIR = 0.1 |
|---|---|---|---|
| Image | 0.9379 | 0.9193 | 0.8758 |
7.5.3 Similarity Score Thresholds at Select FPIR
The values in Table 7.8 correspond to similarity score thresholds observed at the select FPIR values from Table 7.7.
| Probe Content | FPIR = 0.01 | FPIR = 0.02 | FPIR = 0.1 |
|---|---|---|---|
| Image | 71.02 | 61.52 | 54.27 |