5 FBI Laboratory
The results of Section 5 are based on searches of the sequestered dataset FBI Laboratory. This dataset consists of 49 operational latent distal phalanx probes. Examiners at the FBI annotated several of the probe images with EFS features, possibly with algorithm assistance. These examiners then confirmed the ground truth mate. All probes searched were a single sample depicting a region from a distal phalanx. EFS data provided with the probe image may include:
- Pattern classification
- Minutia locations (unconfirmed source)
5.1 Failures
Table 5.1 shows the number of failures to create templates. Table 5.2 shows the number of failures to produce a candidate list.
| Image Type | Content | Failures | Attempts |
|---|---|---|---|
| Exemplar | Image | 0 | 38 |
| Probe | EFS | 0 | 48 |
| Probe | Image | 0 | 49 |
| Probe | Image + EFS | 0 | 49 |
| Probe Content | Failures | Attempts |
|---|---|---|
| EFS | 0 | 48 |
| Image | 0 | 49 |
| Image + EFS | 0 | 49 |
5.2 CMC
5.2.1 Plots
5.2.1.1 All Probes
The CMC plots in Figure 5.1 show the FNIR of griaule+1006 when searching FBI Laboratory against enrollment database where a single mated identity for each search probe was present. The plots are faceted by whether probe EFS data was provided. Tabular versions of FNIR at select ranks can be viewed in Table 5.3.
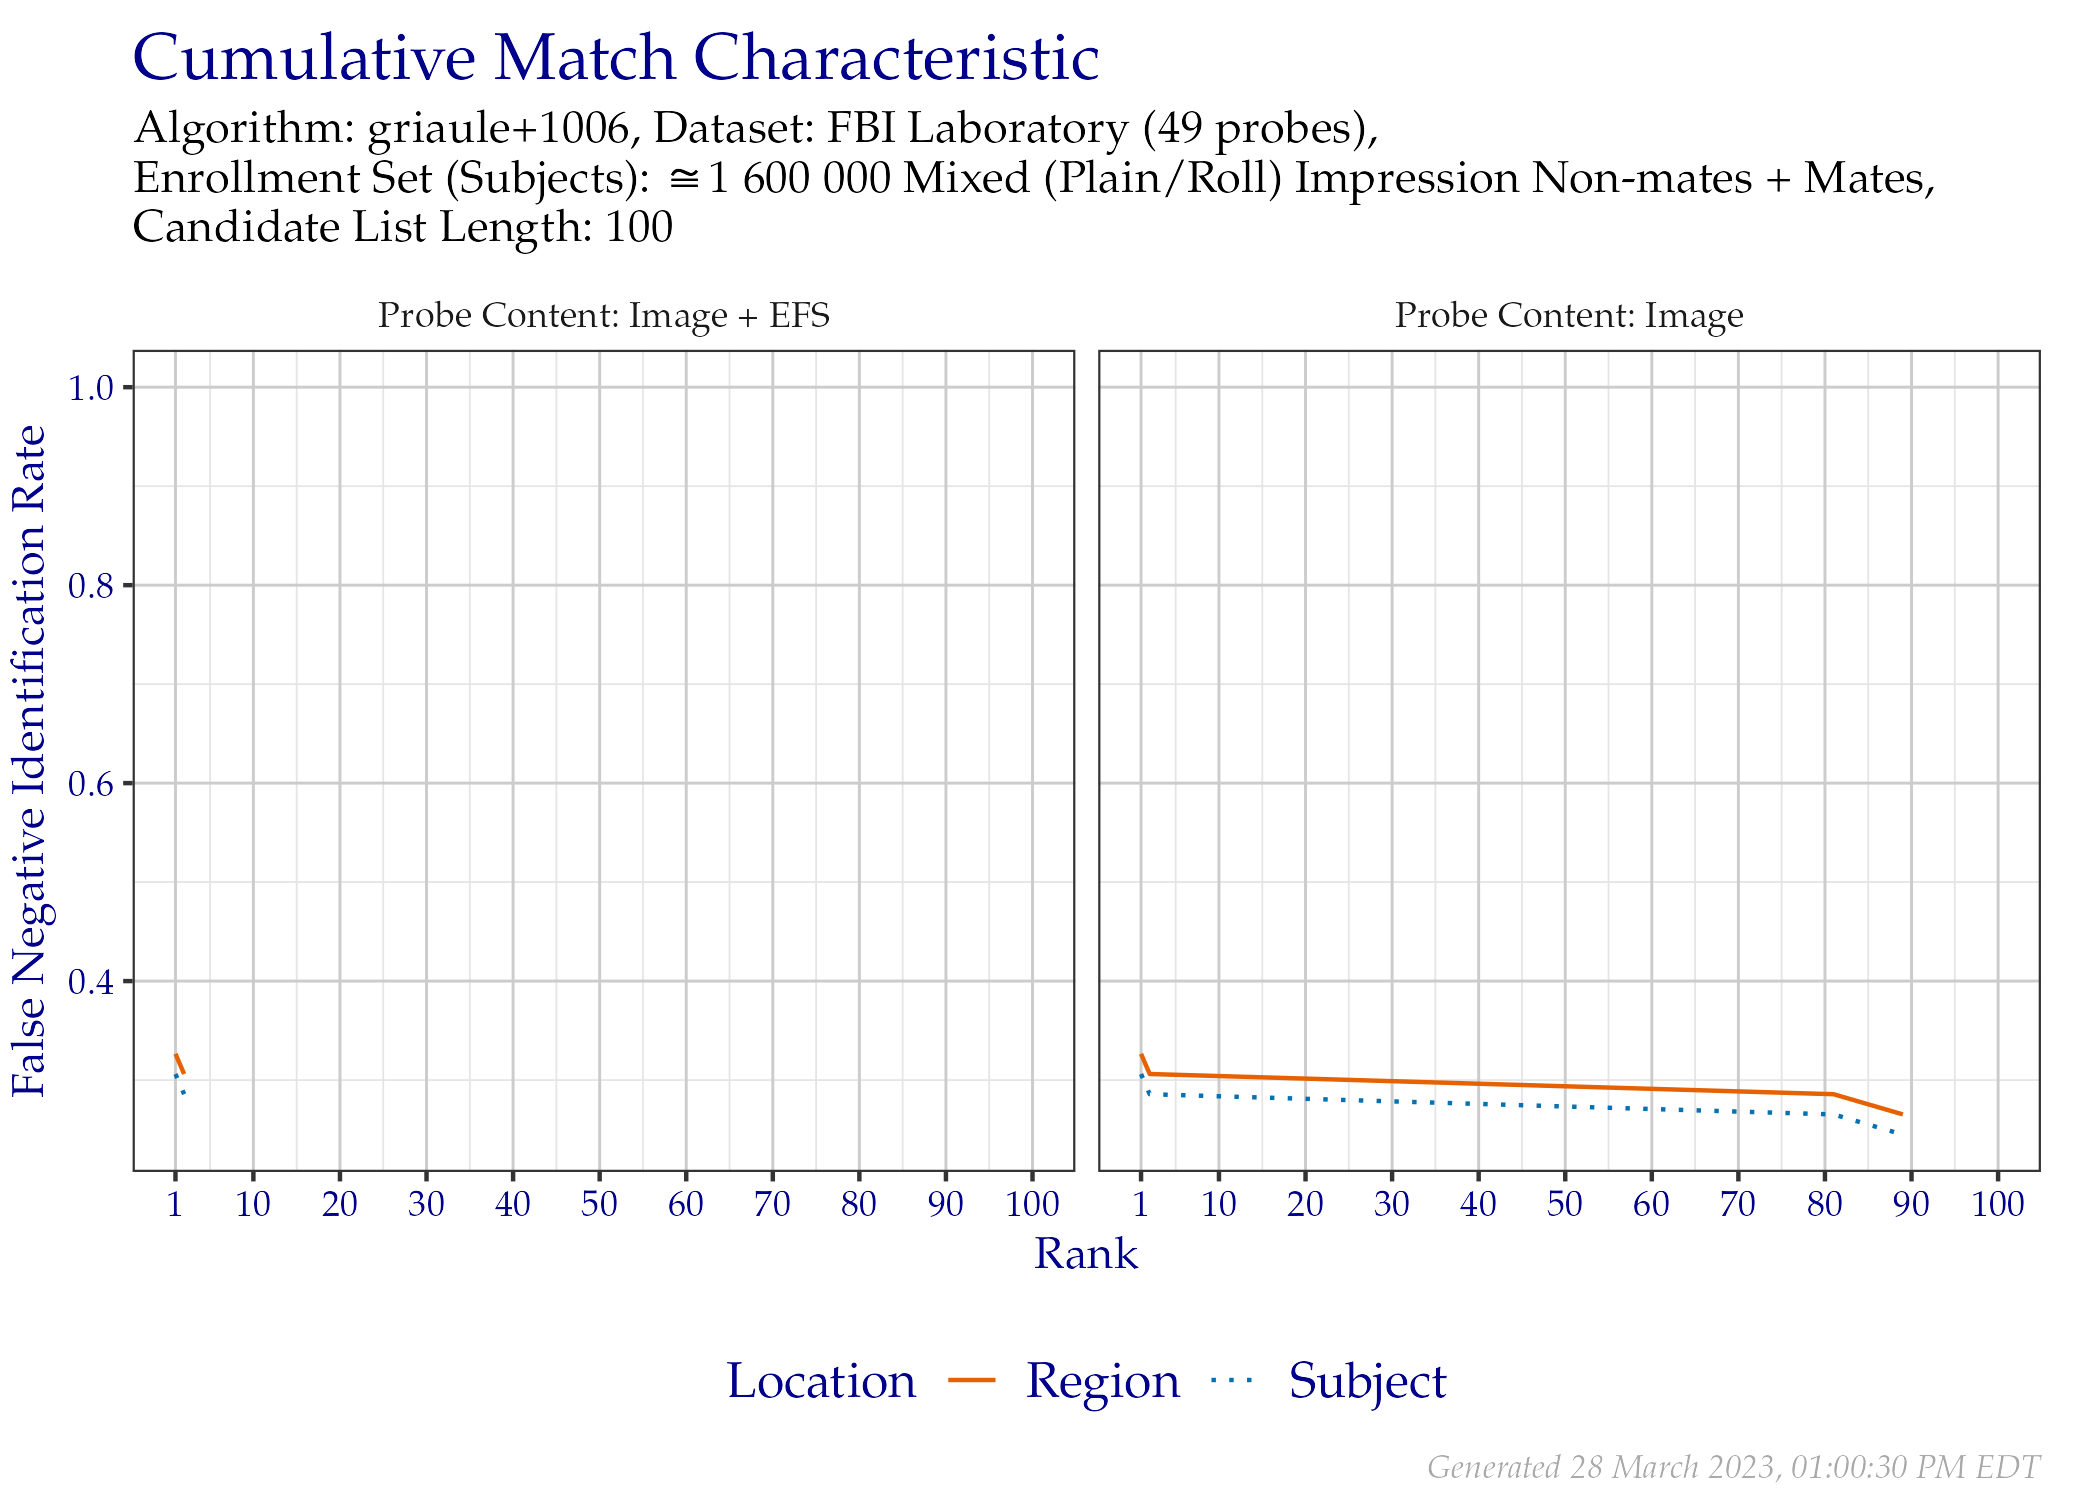
Figure 5.1: CMC when searching FBI Laboratory probes, faceted by whether probe EFS data was provided.
5.2.1.2 Probes with EFS Data
Not all of the probes in the FBI Laboratory dataset contain EFS data. The plot in Figure 5.2 shows the CMC over only the probes that contained EFS data. This plot also differs from Figure 5.1 with the inclusion of a line for probes where no image was provided when creating the probe template, meaning the only information available was EFS data. Only the region success location is shown.
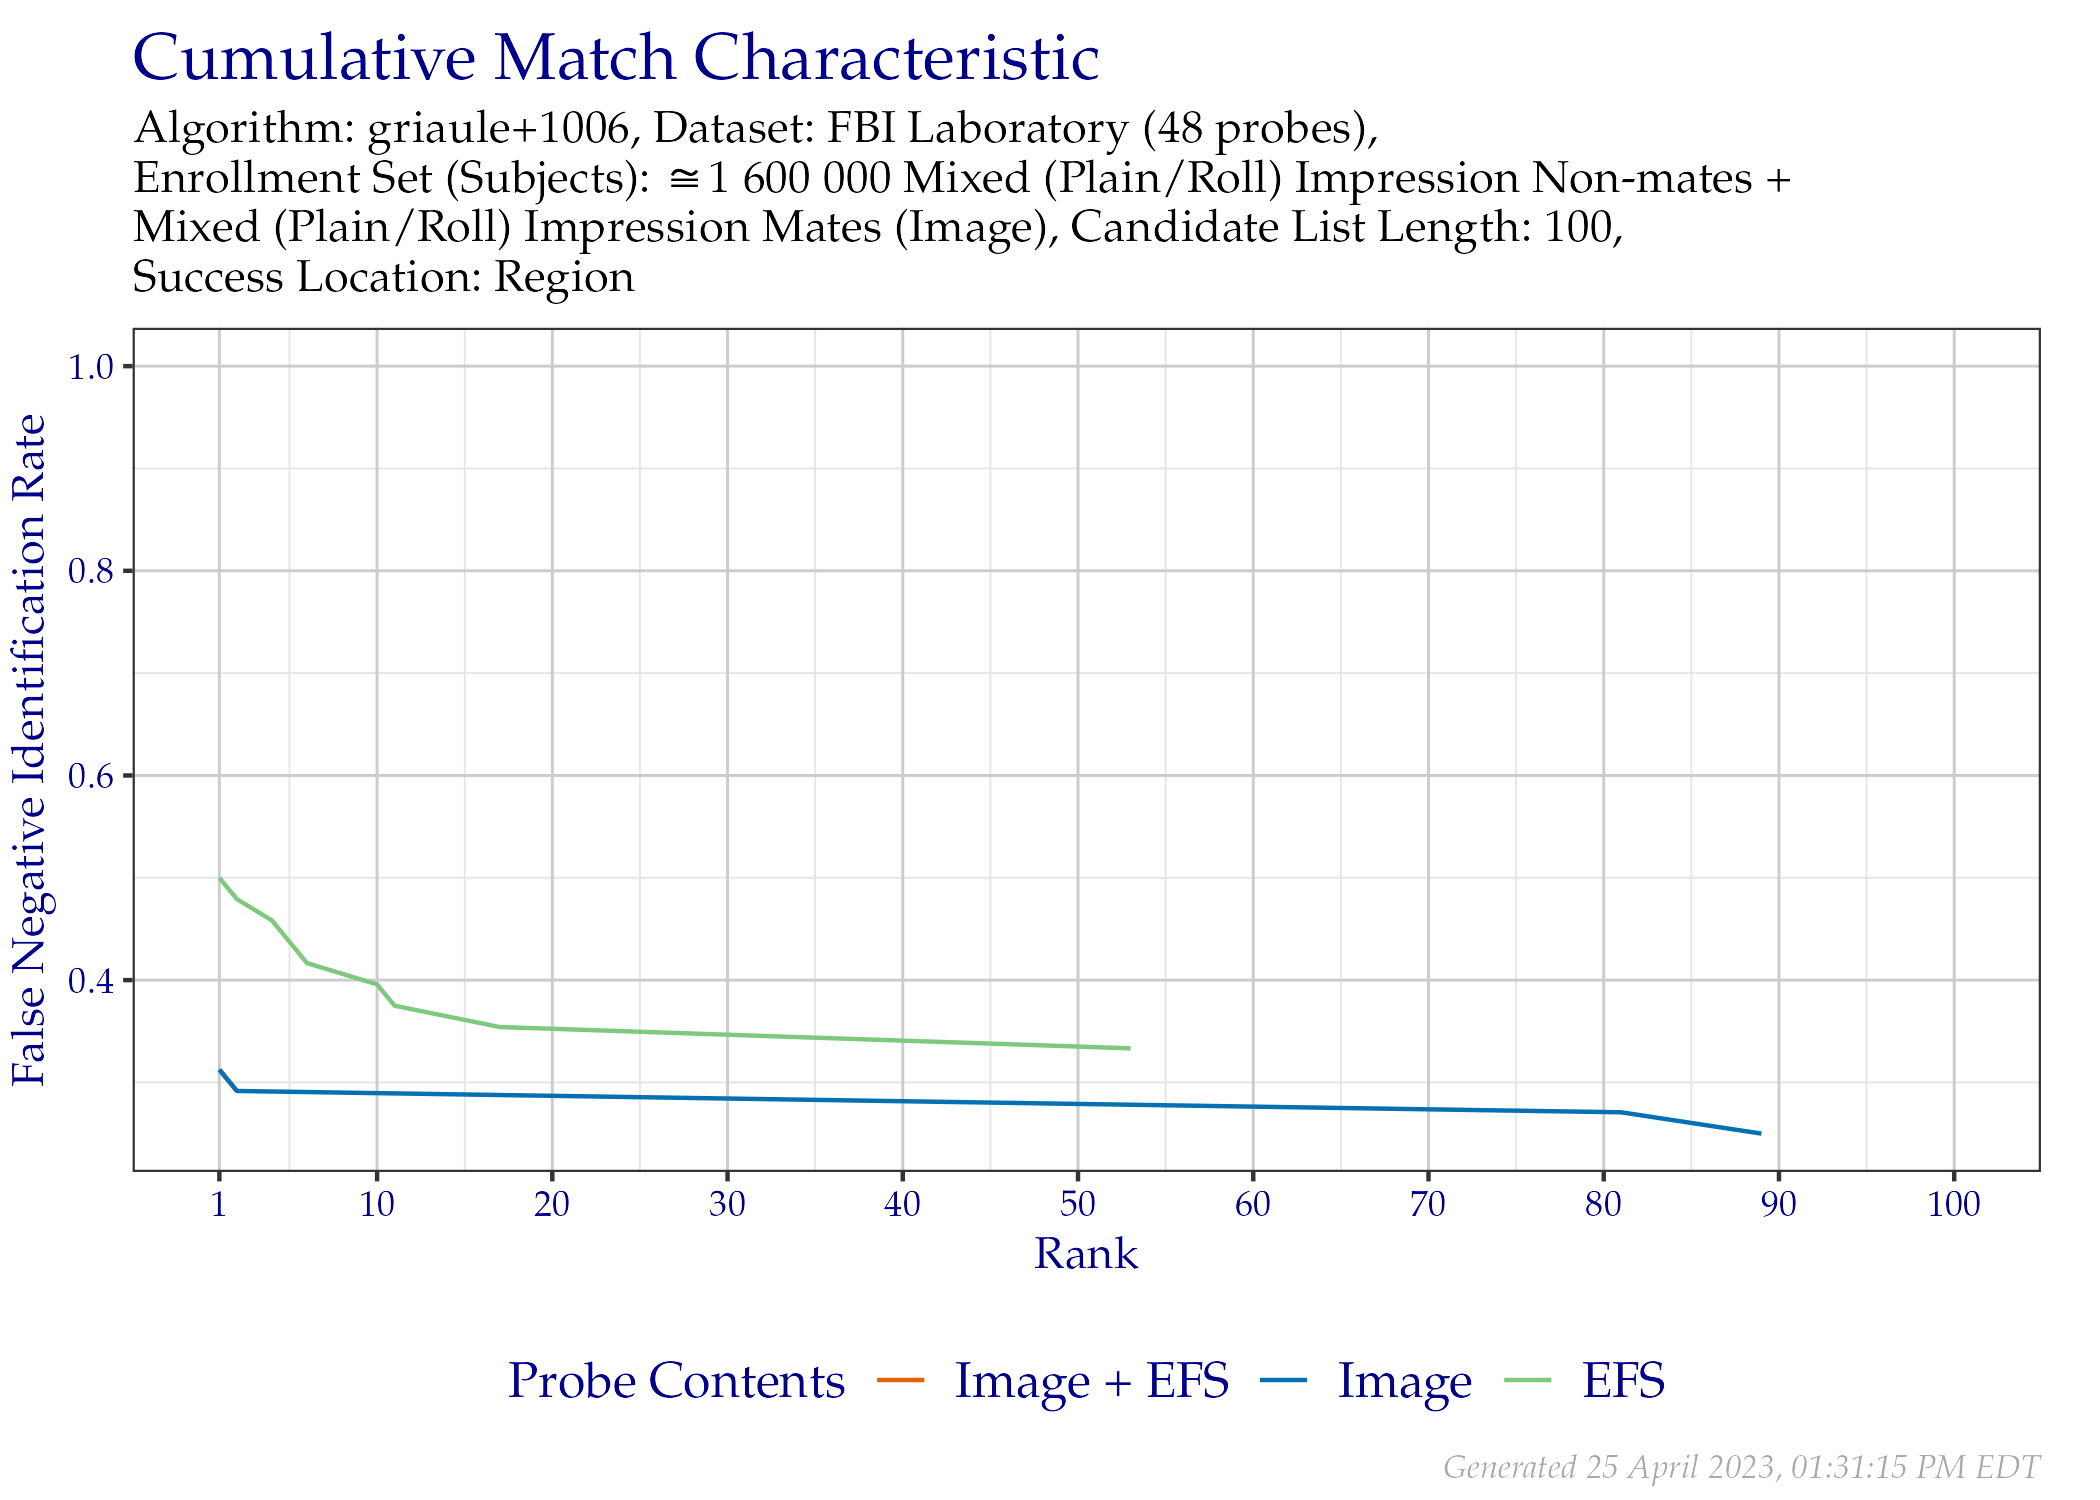
Figure 5.2: CMC of region location when searching only the FBI Laboratory probes that contained EFS data.
5.2.2 FNIR at Select Rank
5.2.2.1 All Probes
The values in Table 5.3 correspond to Figure 5.1.
| Probe Content | Rank 1 | Rank ≤ 2 | Rank ≤ 5 | Rank ≤ 10 | Rank ≤ 50 | Rank ≤ 100 |
|---|---|---|---|---|---|---|
| Image | 0.3265 | 0.3061 | 0.3061 | 0.3061 | 0.3061 | 0.2653 |
| Image + EFS | 0.3265 | 0.3061 | 0.3061 | 0.3061 | 0.3061 | 0.3061 |
5.2.2.2 Probes with EFS Data
The values in Table 5.4 correspond to Figure 5.2.
| Probe Content | Rank 1 | Rank ≤ 2 | Rank ≤ 5 | Rank ≤ 10 | Rank ≤ 50 | Rank ≤ 100 |
|---|---|---|---|---|---|---|
| EFS | 0.5000 | 0.4792 | 0.4375 | 0.3958 | 0.3542 | 0.3333 |
| Image | 0.3125 | 0.2917 | 0.2917 | 0.2917 | 0.2917 | 0.2500 |
| Image + EFS | 0.3125 | 0.2917 | 0.2917 | 0.2917 | 0.2917 | 0.2917 |
5.3 DET
5.3.1 Plots
5.3.1.1 All Probes
The DET plots in Figure 5.3 show the false positive and false negative identification rate tradeoffs of griaule+1006 when searching FBI Laboratory against enrollment database where a single mated identity for each search probe was present. The plots are faceted by whether probe EFS data was provided. Tabular versions of FNIR at select FPIR can be viewed in Table 5.5. Annotated values indicate similarity scores, which are tabulated in Table 5.7.
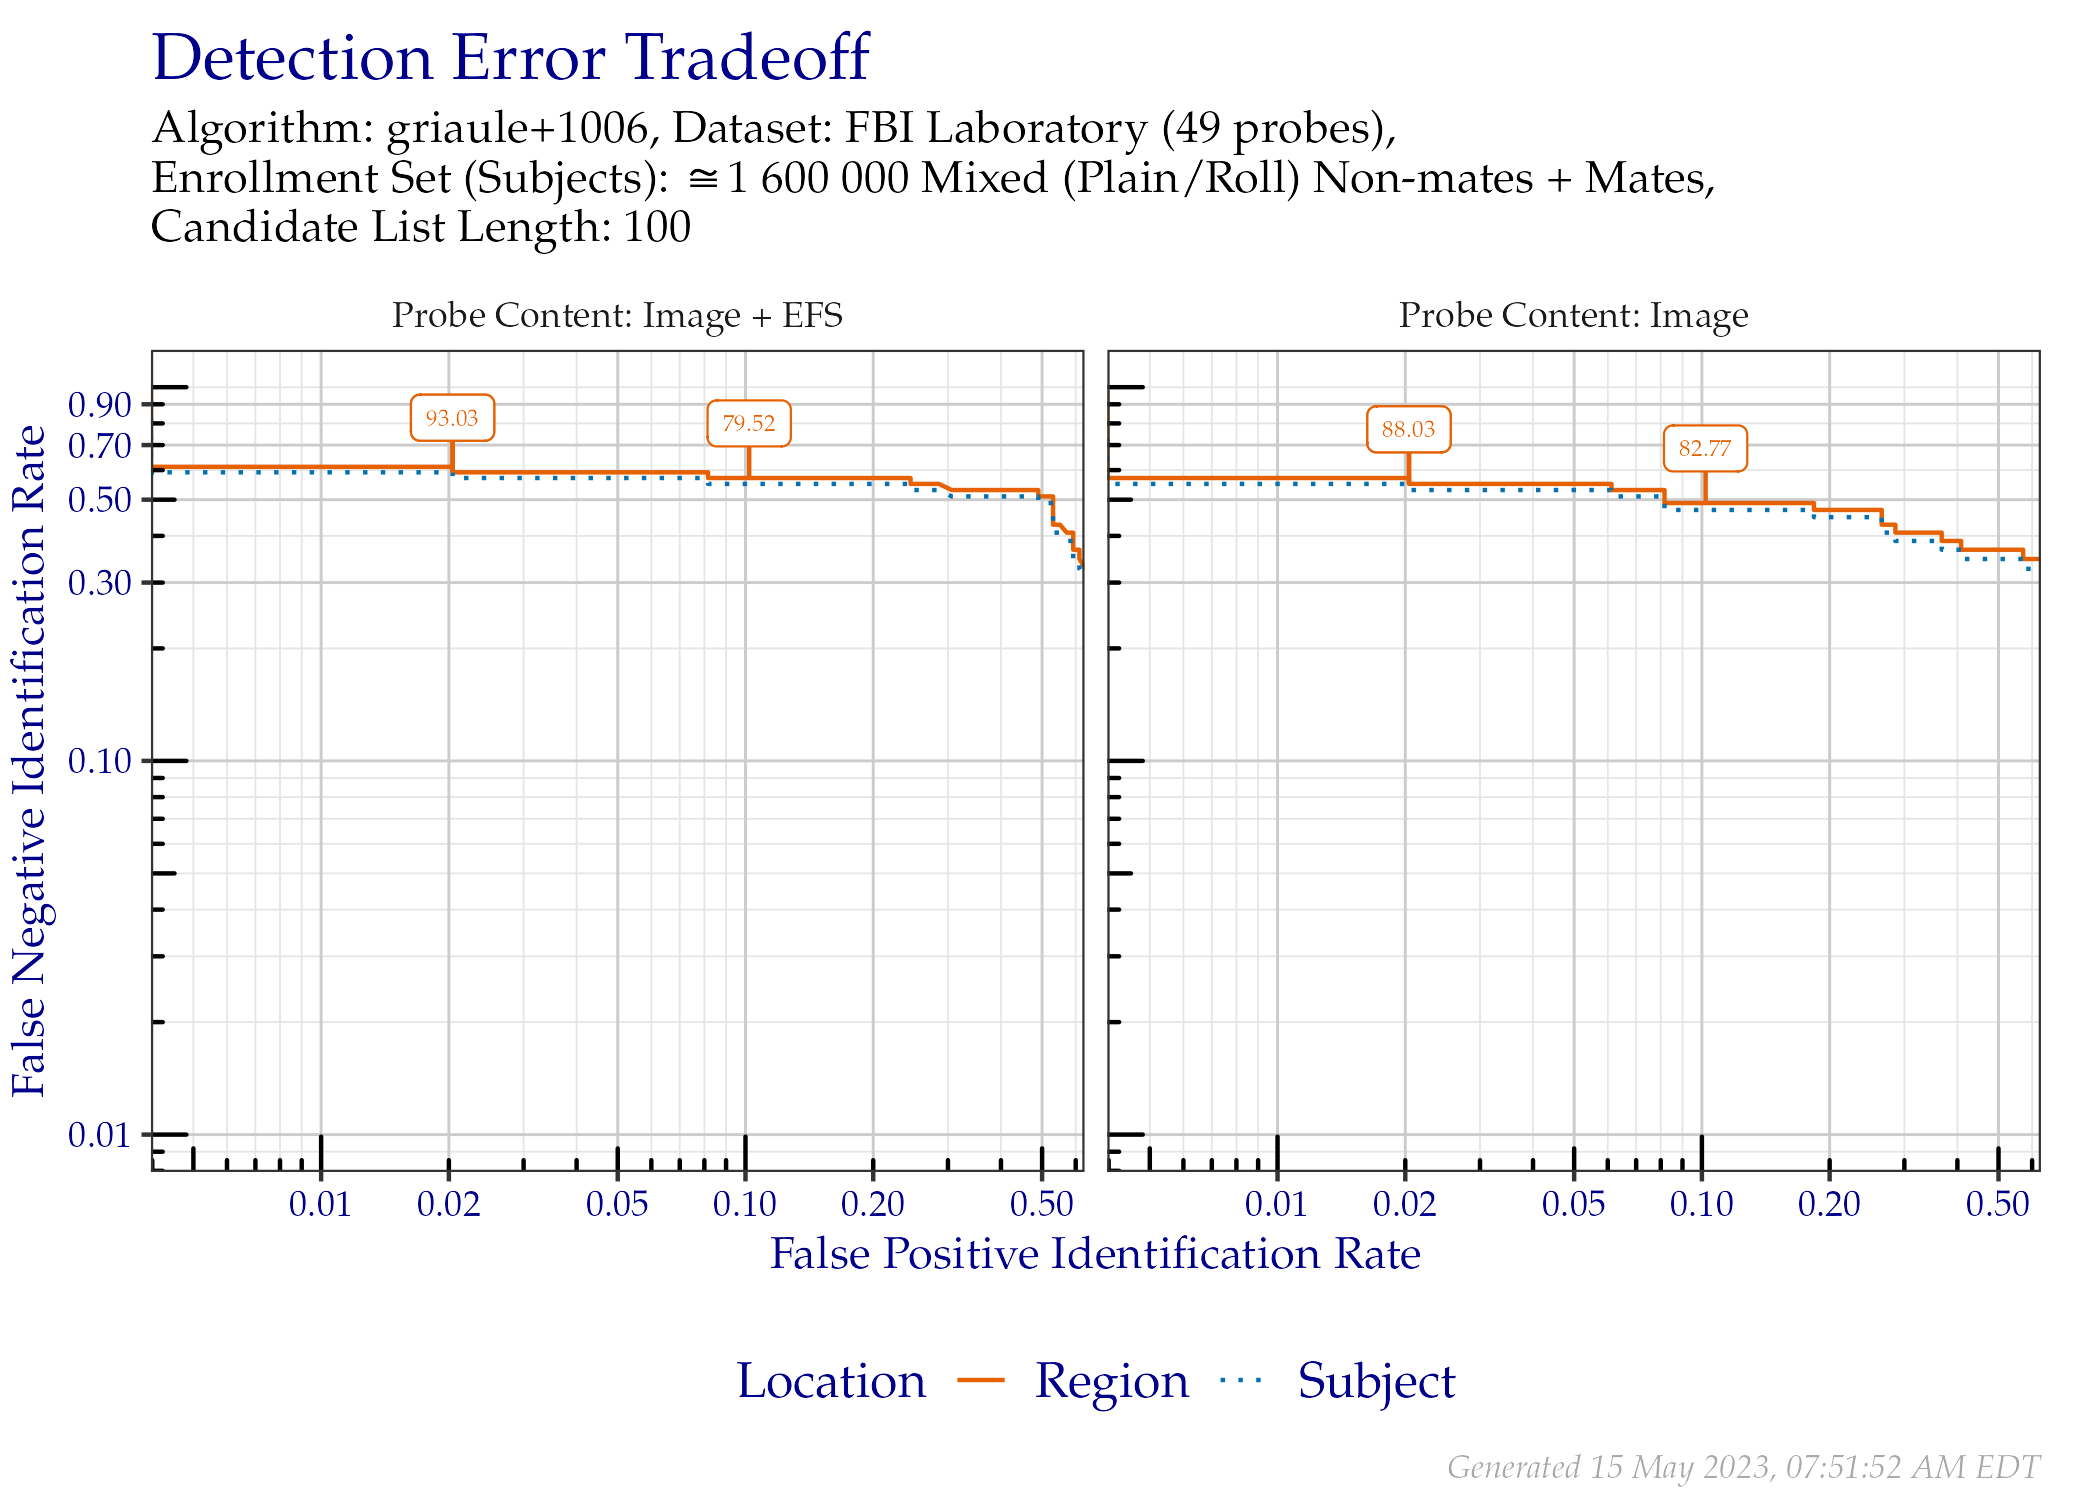
Figure 5.3: DET when searching FBI Laboratory probes, faceted by whether probe EFS data was provided. Annotated values indicate similarity scores.
5.3.1.2 Probes with EFS Data
Not all of the probes in the FBI Laboratory dataset contain EFS data. The plot in Figure 5.4 shows the DET over only the probes that contained EFS data. This plot also differs from Figure 5.3 with the inclusion of a line for probes where no image was provided when creating the probe template, meaning the only information available was EFS data. Only the region success location is shown.
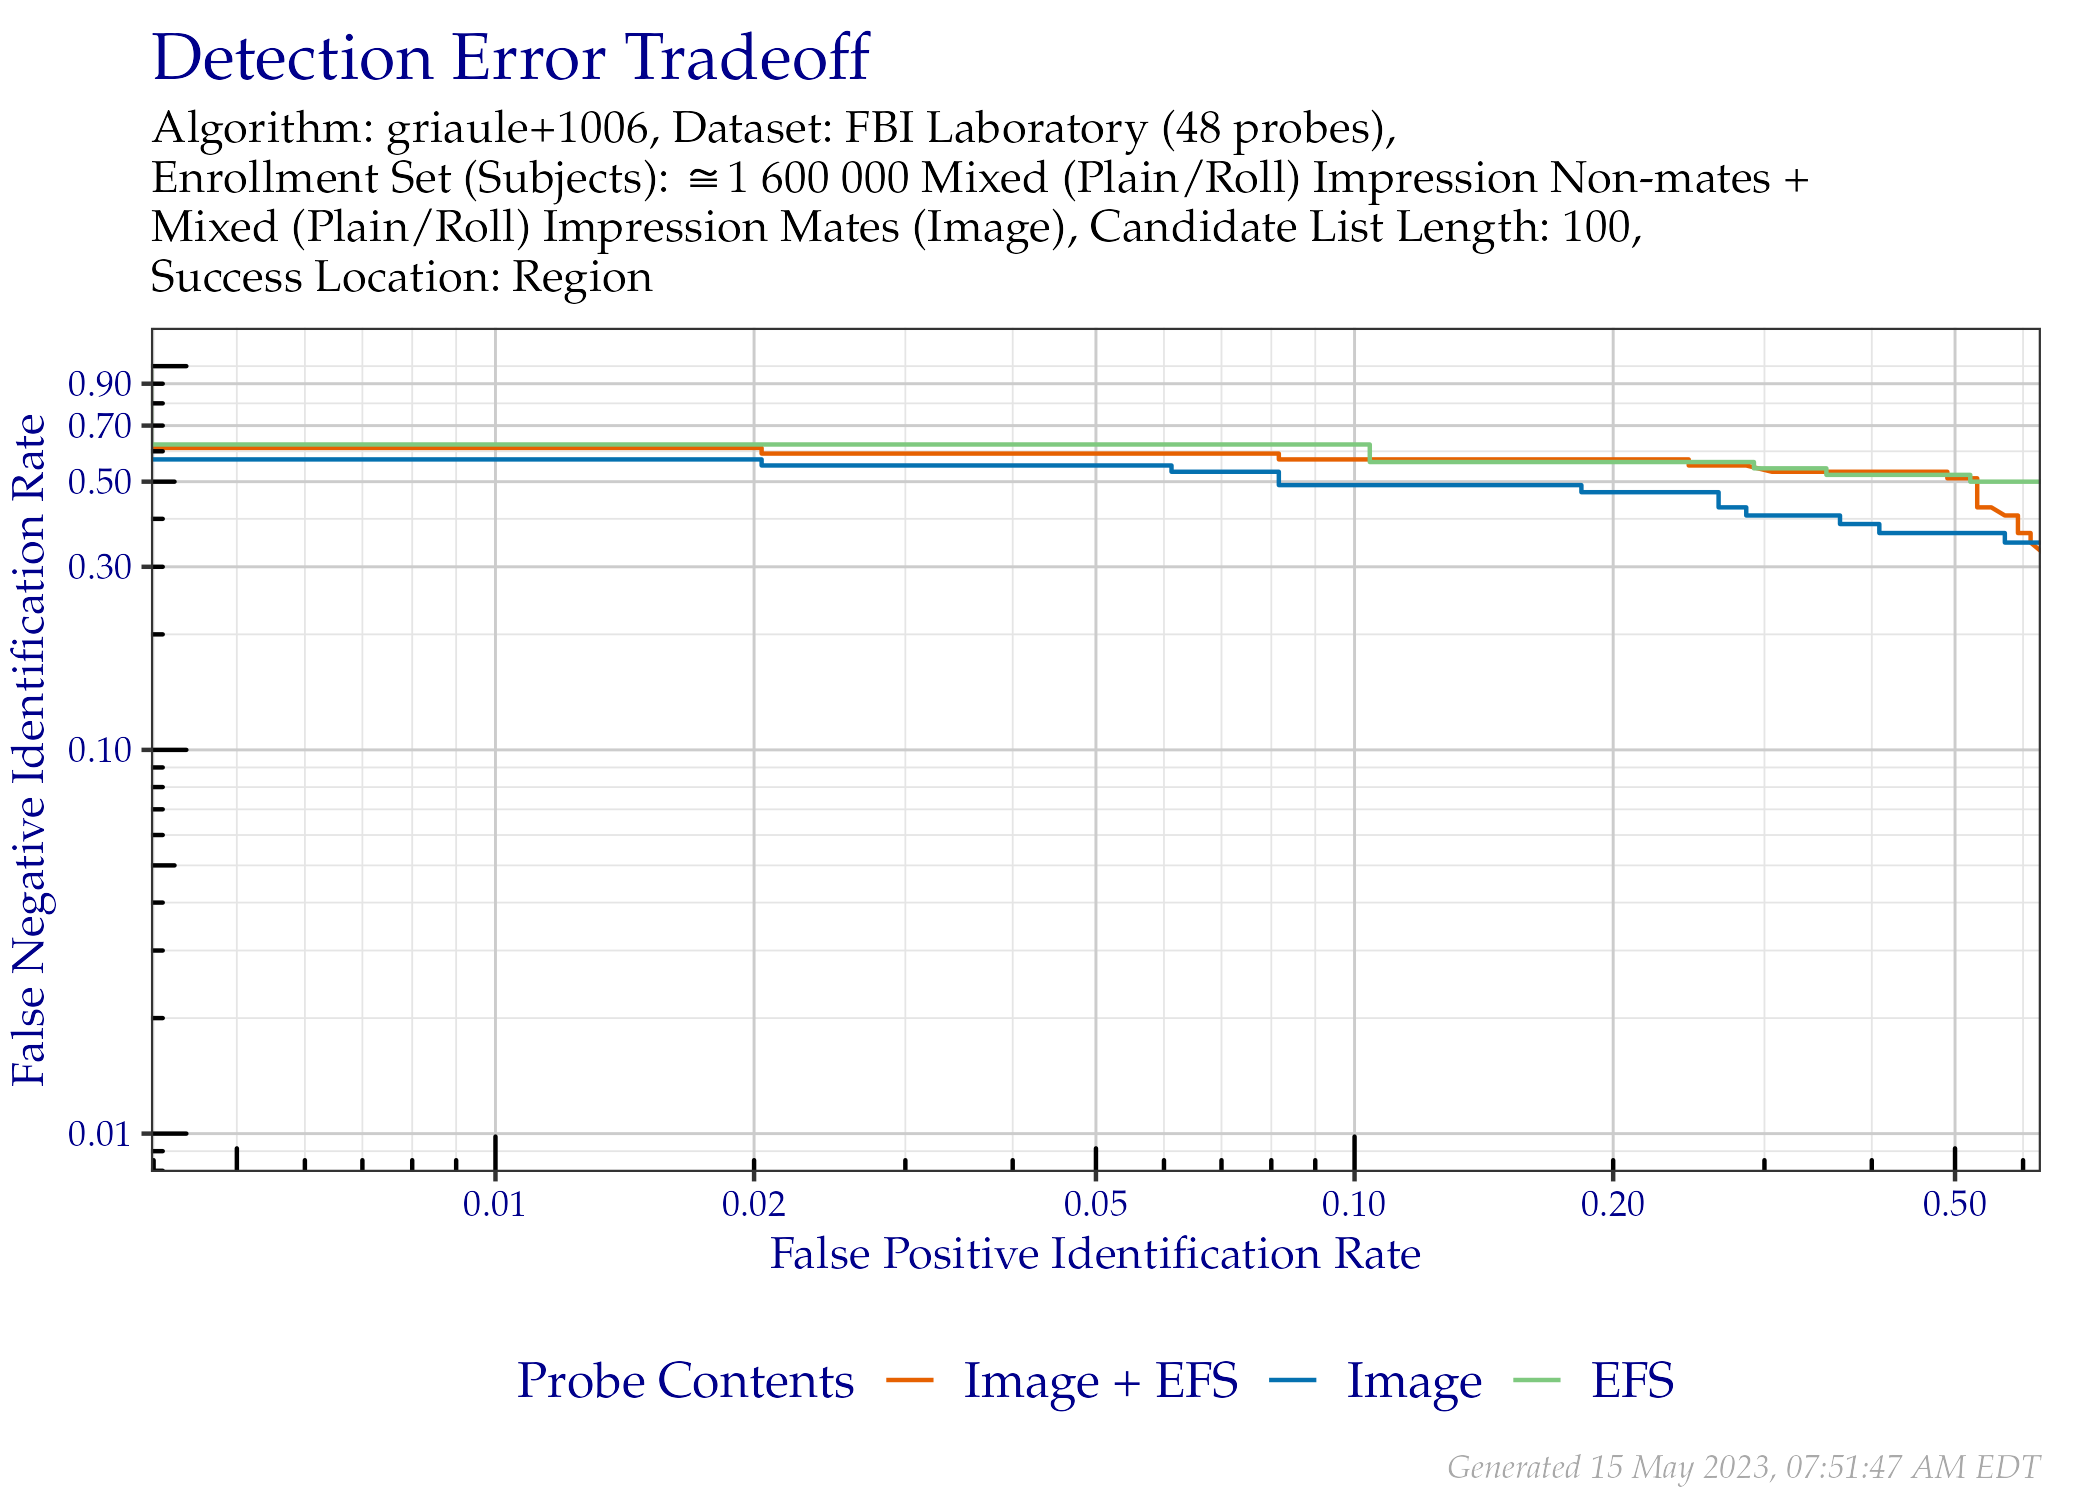
Figure 5.4: DET of region location when searching only the FBI Laboratory probes that contained EFS data.
5.3.2 FNIR at Select FPIR
5.3.3 Similarity Score Thresholds at Select FPIR
The values in Table 5.7 correspond to similarity score thresholds observed at the select FPIR values from Table 5.5.
| Probe Content | FPIR = 0.01 | FPIR = 0.02 | FPIR = 0.1 |
|---|---|---|---|
| Image | 88.03 | 88.03 | 82.77 |
| Image + EFS | 93.03 | 93.03 | 79.52 |