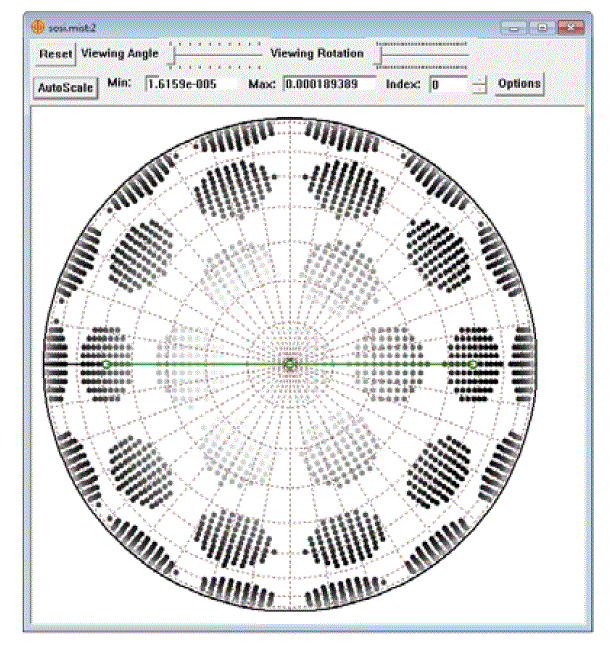
It is often useful to view the sampled points. For example, one can check to see that the integration region matches that which is anticipated. Secondly, one might wish to see where the intensity is strongest on a detector, and where it is weakest. Finally, one might wish to visualize the scattering function over the entire hemisphere. For these reasons, MIST provides a view of the scattering hemisphere with the integrations points shown with their intensities. To view the sampled points, select View→View Samples (Graph) from the main menu. A window will appear:
By default, the integration points are shown over the scattering hemisphere as viewed from the surface normal. By sliding the viewing angle and the viewing rotation slider bars, the direction over which the hemisphere is viewed can be changed:
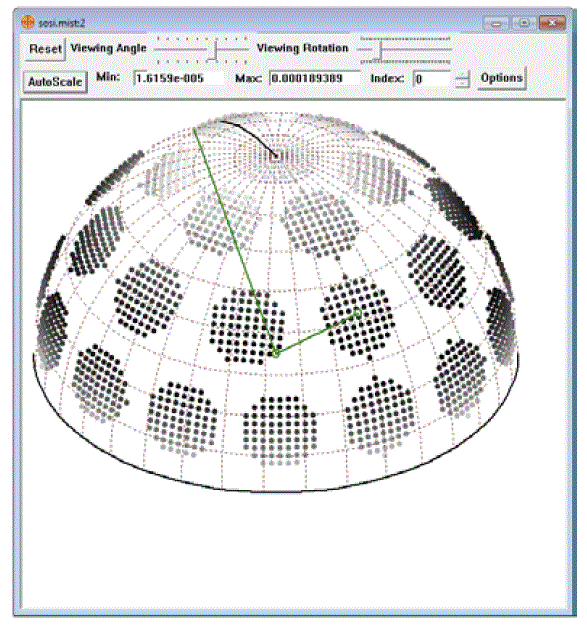
The incident plane is shown with a dark curve starting at the surface normal. The incident and specular beams are shown with green line segments, and the points that the incident and specular beams intersect the hemisphere and the sample are shown as circles.
Index refers to the step index of the FOR loop. By changing the index, one can view the intensity or the shape of the integration domain as a function of the varying parameter.
By pressing the Options button, some parameters used for displaying the sampled points can be changed:
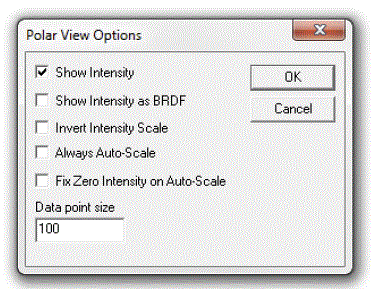
Show Intensity — Checking this box will show the integration points with points whose gray scale depends upon the intensity, while un-checking it will show the integration points in black.
Show Intensity as BRDF — Checking this box will show the gray scale (if the Show Intensity box is checked) corresponding to BRDF, while un-checking it will show it corresponding to differential reflectance (product of BRDF and the cosine of the angle).
Invert Intensity Scale — Checking this box will make the gray scale whiter when the intensity is higher, while un-checking it will show the more intense points as darker.
Always Auto-Scale — Checking this box will ensure that anytime the image changes (due to calculation or looking at a different step), that the results will be auto-scaled over the range of intensities.
Fix Zero Intensity on Auto-Scale — Checking this box will set the lowest intensity scale to zero, while un-checking it will set the bottom of the scale to the lowest intensity shown.
Data point size — This parameter sets the size of the circles used to show the integration points. By default, this value is 100. One can effectively show a map of intensity by setting this number so that the points fill the gaps between adjacent points.
SCATMECH Technical Information and Questions
Sensor Science Division Home Page
Sensor Science Division Inquiries
Website Comments
Latest MIST Version: 4.10 (October 2017)