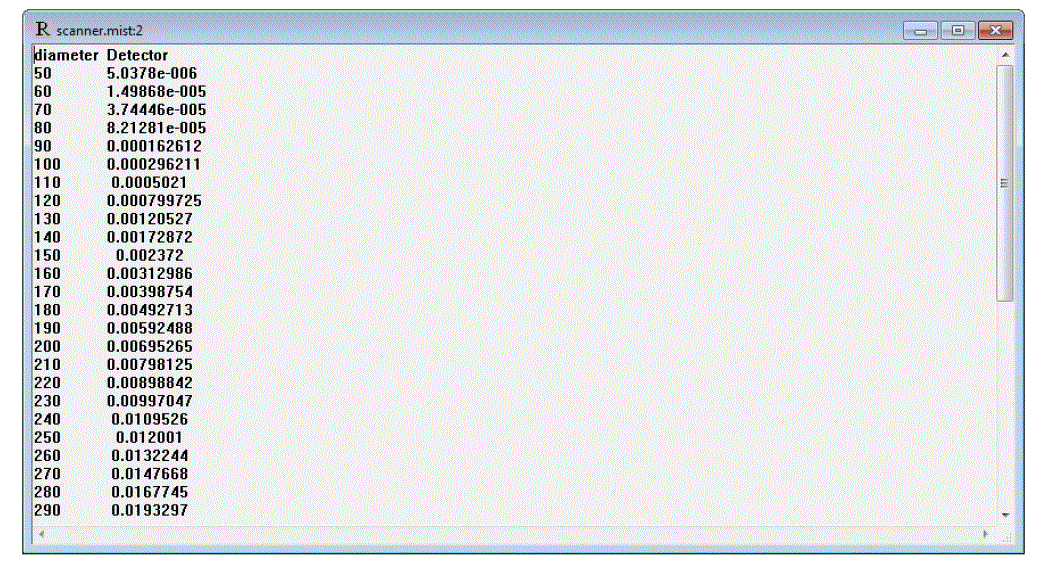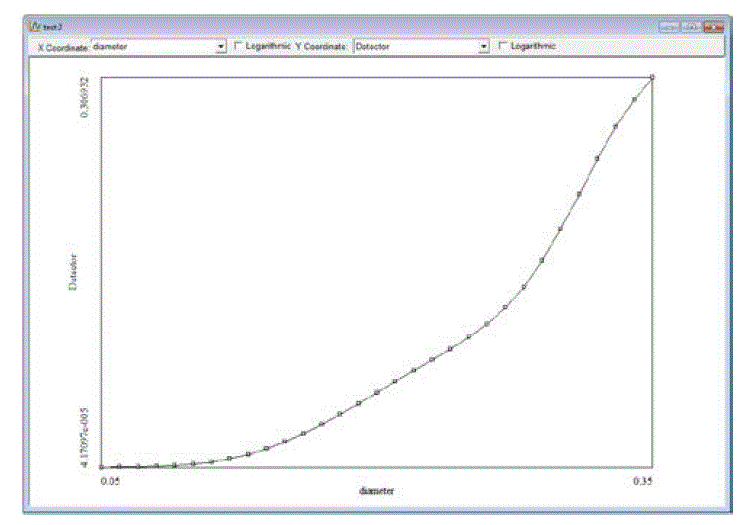
There are three different ways to view the output. First, one can use a separate spreadsheet application to read the output file (named by the document name with the extension .dat, or that specified by the results parameter). Secondly, one can view the contents of this file in a text window supplied by MIST. Finally, a rudimentary graph can be displayed, showing the outputs as a function of the parametric variables.
To view the contents in a text window, select View→View Results (Text) from the main menu. This view is useful when one wants to see the specific numbers:

One can use this window to copy and paste into other spreadsheet applications.
To view a graph of the results, select View→View Results (Graph) from the main menu. A window opens up showing the data as a function of the variable(s) defined in the FOR loops.

The results may be plotted against linear or logarithmic axes. For more advanced graphing and control over axes and labels, other spreadsheet applications can be used.
SCATMECH Technical Information and Questions
Sensor Science Division Home Page
Sensor Science Division Inquiries
Website Comments
Latest MIST Version: 4.10 (October 2017)