Bootstrap Confidence for Segmentation Statistics
This section shows the same detailed results of segmentation of FiveInch data from Section 4.3, but with an added bootstrap confidence interval. For each observation, a bootstrap routine with 1 000 replicates was run, and a 95 % confidence interval extracted. The lower and upper confidence from that confidence interval are printed in each column within square brackets.
In Table C.1, results are shown of how successful thalescogent+0003 segmented fingers for each subject in the test corpus. Table C.2 shows success for specific finger positions over the entire test corpus. Similarly, Table C.3 shows success for segmenting the same finger position from both hands.
The remainder of the tables show success per subject when considering combinations of subsets of the fingers in each slap image. Table C.4 shows success for combinations of all fingers, Table C.6 for the all except the little finger, and Table C.5 for just the index and middle fingers.
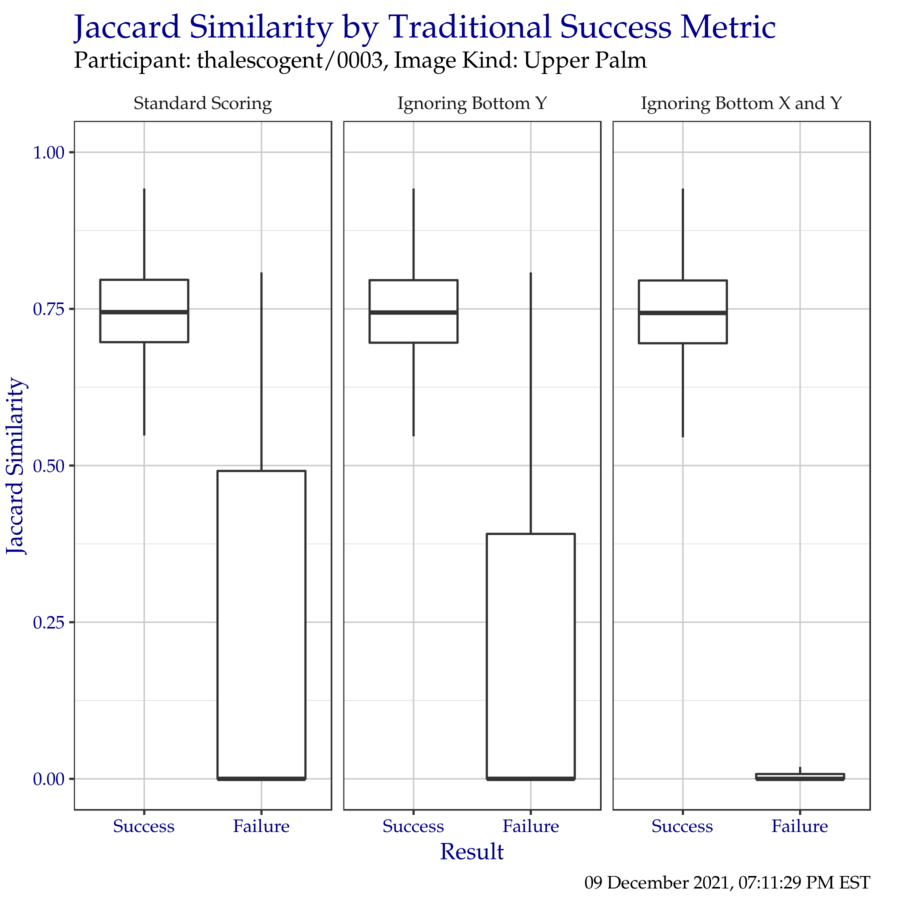
Table C.1: For each subject, the percentage that at least Number of Fingers fingers were correctly segmented, regardless of hand, for a maximum of eight correctly-segmented fingers. In Standard Scoring, scoring rules are followed exactly. In Ignoring Bottom Y, the bottom left and bottom right Y coordinates are ignored. Ignoring Bottom X and Y only checks the locations of the top left and top right coordinates. Values in square brackets represent a 95 % confidence interval after bootstrapping with 1 000 replicates.
|
Number of Fingers
|
Standard Scoring
|
Ignoring Bottom Y
|
Ignoring Bottom X and Y
|
|
1
|
95.9 [94.3, 97.2]
|
96.2 [94.9, 97.5]
|
96.2 [94.9, 97.6]
|
|
2
|
92.8 [90.9, 94.6]
|
92.9 [91.2, 94.6]
|
92.9 [91.0, 94.7]
|
|
3
|
88.3 [85.9, 90.4]
|
88.4 [86.0, 90.5]
|
88.8 [86.6, 91.0]
|
|
4
|
83.1 [80.4, 85.8]
|
83.1 [80.2, 85.6]
|
83.7 [80.9, 86.3]
|
|
5
|
73.4 [70.2, 76.4]
|
74.3 [71.3, 77.5]
|
74.8 [71.5, 77.9]
|
|
6
|
65.9 [62.6, 69.2]
|
66.4 [63.1, 69.7]
|
67.7 [64.3, 71.1]
|
|
7
|
55.2 [51.8, 58.8]
|
56.8 [53.1, 60.1]
|
58.8 [55.5, 62.5]
|
|
8
|
38.2 [34.9, 41.8]
|
39.8 [36.2, 43.3]
|
42.3 [38.9, 45.3]
|
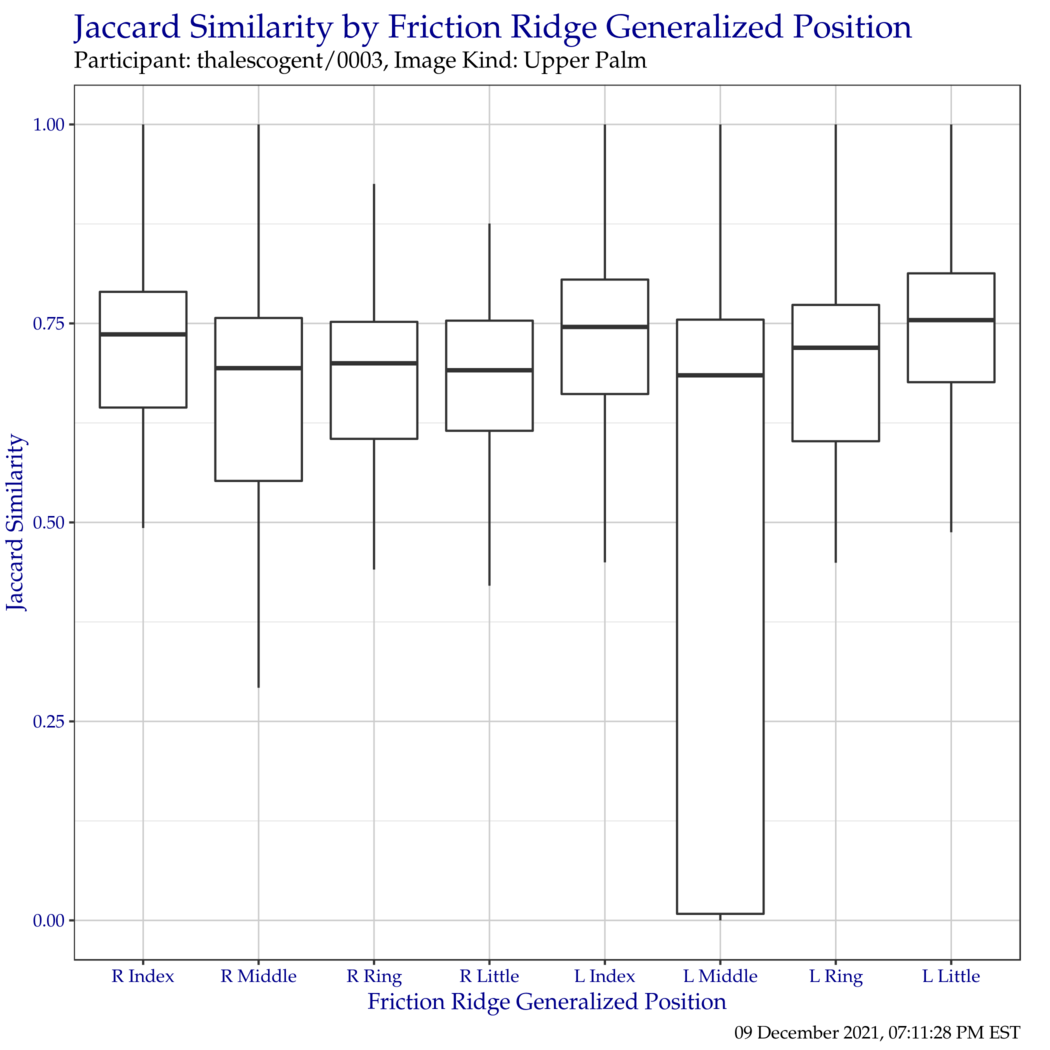
Table C.2: For all subjects, Percentage that a particular friction ridge generalized position was correctly segmented. In Ignoring Bottom Y, the bottom left and bottom right Y coordinates are ignored. Ignoring Bottom X and Y only checks the locations of the top left and top right coordinates. Values in square brackets represent a 95 % confidence interval after bootstrapping with 1 000 replicates.
|
Finger
|
Standard Scoring
|
Ignoring Bottom Y
|
Ignoring Bottom X and Y
|
|
Right
|
|
Index
|
77.9 [74.9, 80.7]
|
78.2 [75.3, 81.1]
|
78.7 [75.5, 81.6]
|
|
Middle
|
67.6 [64.2, 71.0]
|
68.8 [65.7, 72.3]
|
70.5 [67.0, 73.7]
|
|
Ring
|
74.3 [71.1, 77.5]
|
75.3 [72.1, 78.2]
|
77.4 [74.5, 80.3]
|
|
Little
|
77.8 [74.6, 80.6]
|
78.1 [75.1, 81.0]
|
78.6 [75.8, 81.5]
|
|
Left
|
|
Index
|
77.3 [74.1, 80.4]
|
77.7 [74.8, 80.8]
|
78.4 [75.6, 81.4]
|
|
Middle
|
66.2 [62.6, 69.6]
|
66.7 [63.4, 70.2]
|
66.8 [63.5, 70.6]
|
|
Ring
|
74.5 [71.5, 77.6]
|
75.7 [72.7, 78.6]
|
76.0 [72.8, 79.2]
|
|
Little
|
81.8 [79.3, 84.5]
|
82.2 [79.4, 84.7]
|
83.6 [80.9, 86.1]
|
Table C.3: Percentage that a particular type of fingerprint was correctly segmented on Either or Both hands. In Ignoring Bottom Y, the bottom left and bottom right Y coordinates are ignored. Ignoring Bottom X and Y only checks the locations of the top left and top right coordinates. Values in square brackets represent a 95 % confidence interval after bootstrapping with 1 000 replicates.
|
Fingers
|
Standard Scoring
|
Ignoring Bottom Y
|
Ignoring Bottom X and Y
|
|
Index
|
|
Either
|
88.9 [86.7, 91.2]
|
88.9 [86.8, 91.2]
|
89.2 [87.0, 91.4]
|
|
Both
|
65.1 [61.7, 68.4]
|
65.7 [62.6, 68.9]
|
66.7 [63.2, 70.1]
|
|
Middle
|
|
Either
|
79.8 [76.5, 82.7]
|
80.6 [77.9, 83.5]
|
81.6 [78.7, 84.3]
|
|
Both
|
52.8 [49.3, 56.3]
|
53.8 [50.3, 57.3]
|
54.7 [51.0, 58.1]
|
|
Ring
|
|
Either
|
85.8 [83.3, 88.3]
|
86.3 [83.9, 88.7]
|
86.4 [83.8, 88.9]
|
|
Both
|
61.9 [58.2, 65.5]
|
63.5 [59.9, 66.8]
|
65.7 [62.2, 69.0]
|
|
Little
|
|
Either
|
91.6 [89.5, 93.4]
|
92.0 [90.0, 93.7]
|
92.1 [90.1, 93.9]
|
|
Both
|
66.8 [63.6, 70.1]
|
67.1 [63.9, 70.5]
|
68.8 [65.3, 72.1]
|
Table C.4: Percentage of segmentation success by hand for combinations of all eight fingers of a FiveInch slap. In Ignoring Bottom Y, the bottom left and bottom right Y coordinates are ignored. Ignoring Bottom X and Y only checks the locations of the top left and top right coordinates. Values in square brackets represent a 95 % confidence interval after bootstrapping with 1 000 replicates.
|
Fingers
|
Standard Scoring
|
Ignoring Bottom Y
|
Ignoring Bottom X and Y
|
|
Right
|
|
Any
|
90.0 [88.8, 91.7]
|
90.2 [89.0, 91.9]
|
90.2 [89.1, 92.0]
|
|
At Least Two
|
82.4 [80.0, 83.9]
|
82.4 [80.2, 83.9]
|
83.0 [80.9, 84.5]
|
|
At Least Three
|
71.8 [69.5, 74.0]
|
72.1 [69.6, 74.4]
|
74.1 [71.1, 75.8]
|
|
All Four
|
53.3 [52.1, 57.3]
|
55.6 [53.9, 59.0]
|
58.0 [55.8, 60.7]
|
|
Left
|
|
Any
|
90.5 [88.8, 91.7]
|
90.8 [89.0, 91.9]
|
91.1 [89.1, 92.0]
|
|
At Least Two
|
81.6 [80.0, 83.9]
|
81.8 [80.2, 83.9]
|
82.4 [80.9, 84.5]
|
|
At Least Three
|
71.9 [69.5, 74.0]
|
72.3 [69.6, 74.4]
|
72.9 [71.1, 75.8]
|
|
All Four
|
56.0 [52.1, 57.3]
|
57.4 [53.9, 59.0]
|
58.4 [55.8, 60.7]
|
Table C.5: Percentage of segmentation success by hand when only considering combinations of index and middle fingers. In Ignoring Bottom Y, the bottom left and bottom right Y coordinates are ignored. Ignoring Bottom X and Y only checks the locations of the top left and top right coordinates. Values in square brackets represent a 95 % confidence interval after bootstrapping with 1 000 replicates.
|
Fingers
|
Standard Scoring
|
Ignoring Bottom Y
|
Ignoring Bottom X and Y
|
|
Right
|
|
Either Index or Middle
|
82.8 [80.7, 84.5]
|
82.8 [80.7, 84.5]
|
83.2 [80.9, 84.8]
|
|
Both Index and Middle
|
62.6 [59.2, 64.2]
|
64.1 [60.6, 65.5]
|
66.0 [61.8, 66.7]
|
|
Left
|
|
Either Index or Middle
|
82.4 [80.7, 84.5]
|
82.4 [80.7, 84.5]
|
82.8 [80.9, 84.8]
|
|
Both Index and Middle
|
61.1 [59.2, 64.2]
|
62.1 [60.6, 65.5]
|
62.5 [61.8, 66.7]
|
Table C.6: Percentage of segmentation success by hand when only considering combinations of index, middle, and ring fingers. In Ignoring Bottom Y, the bottom left and bottom right Y coordinates are ignored. Ignoring Bottom X and Y only checks the locations of the top left and top right coordinates. Values in square brackets represent a 95 % confidence interval after bootstrapping with 1 000 replicates.
|
Fingers
|
Standard Scoring
|
Ignoring Bottom Y
|
Ignoring Bottom X and Y
|
|
Right
|
|
Any
|
85.6 [83.5, 87.1]
|
85.6 [83.7, 87.3]
|
85.8 [84.0, 87.5]
|
|
At Least Two
|
75.9 [72.8, 77.6]
|
76.2 [73.4, 77.6]
|
77.4 [74.0, 78.4]
|
|
All Three
|
58.2 [55.9, 60.9]
|
60.4 [57.8, 62.7]
|
63.4 [59.6, 64.4]
|
|
Left
|
|
Any
|
85.0 [83.5, 87.1]
|
85.4 [83.7, 87.3]
|
85.7 [84.0, 87.5]
|
|
At Least Two
|
74.4 [72.8, 77.6]
|
74.8 [73.4, 77.6]
|
75.2 [74.0, 78.4]
|
|
All Three
|
58.6 [55.9, 60.9]
|
59.9 [57.8, 62.7]
|
60.3 [59.6, 64.4]
|