3 Identification Flats (“ThreeInch” Data)
3.1 Segmentation Timing
All algorithms are run over a small fixed corpus of ThreeInch images to estimate the total runtime of the evaluation. To be evaluated under SlapSeg III, algorithms must segment the timing corpus, on average, in under 1 500 milliseconds. This maximum reference time is documented in the SlapSeg III test plan, and is subject to change.
Box plots of segmentation times are separated by hand in Figure 3.1, with tabular representations are enumerated in Table 3.1. Results are reported in milliseconds
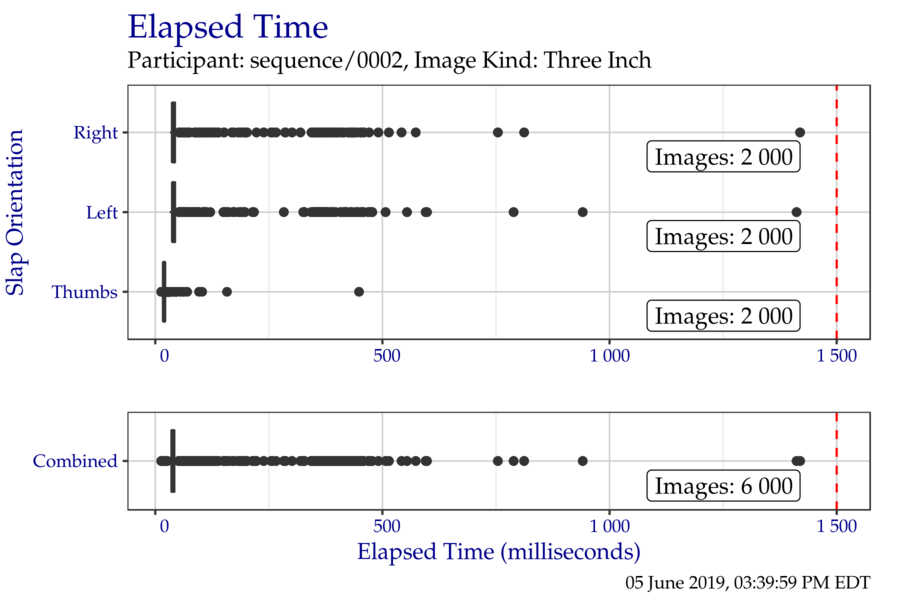
Figure 3.1: Box plots of elapsed time in milliseconds when segmenting the ThreeInch timing test corpus, separated by slap orientation.
| Right | Left | Thumbs | Combined | |
|---|---|---|---|---|
| Minimum | 33 | 32 | 13 | 13 |
| 25% | 37 | 38 | 18 | 36 |
| Median | 39 | 39 | 19 | 38 |
| 75% | 43 | 43 | 21 | 42 |
| Maximum | 1 419 | 1 412 | 449 | 1 419 |
3.2 Segmentation Centers and Dimensions
3.2.1 Segmentation Centers
The plots in this section show the distribution of segmentation position centers (x, y) for ThreeInch data. At the top of each figure is a combined plot for all finger positions of a given hand orientation. These figures are isolated in plots faceted at the bottom of the figure.
Plots of segmentation centers for the right hand ThreeInch data are shown in Figure 3.2, for the left hand in Figure 3.3, and for thumbs in Figure 3.4. Blank lines that may appear in the plots are not rendering artifacts. Rather, they are indicative of image downsampling. Centers have been normalized to 500 pixels per inch.
Points in each plot are plotted with a semi-transparent opacity. This results in points of particular color appearing “darker” to indicate a higher frequency of the observed value, while “lighter” points indicate a lower observed frequency.
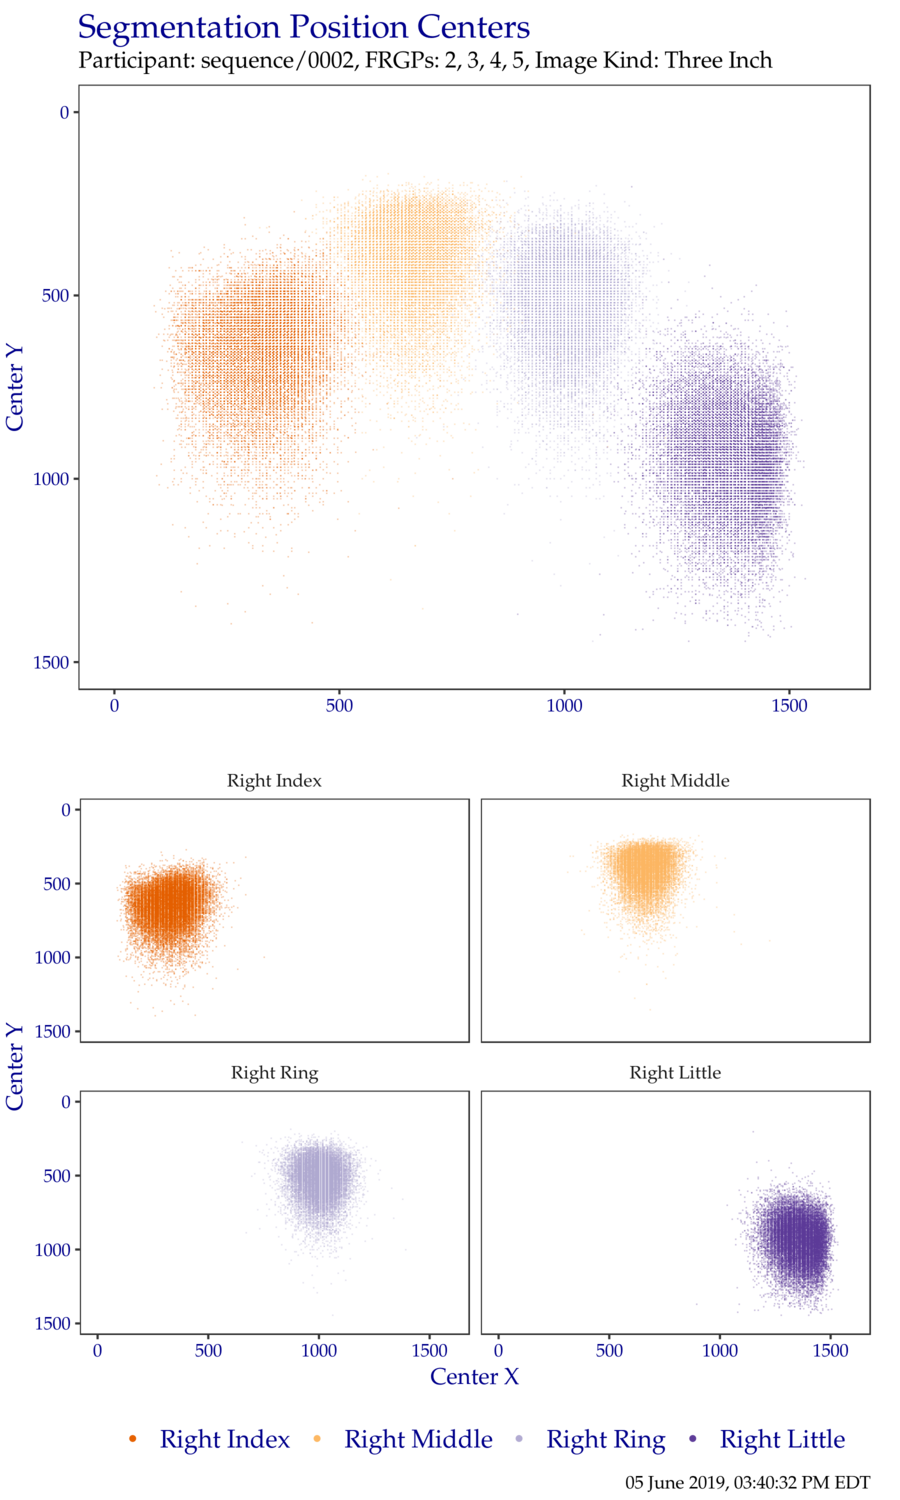
Figure 3.2: Segmentation centers for right hand ThreeInch data.
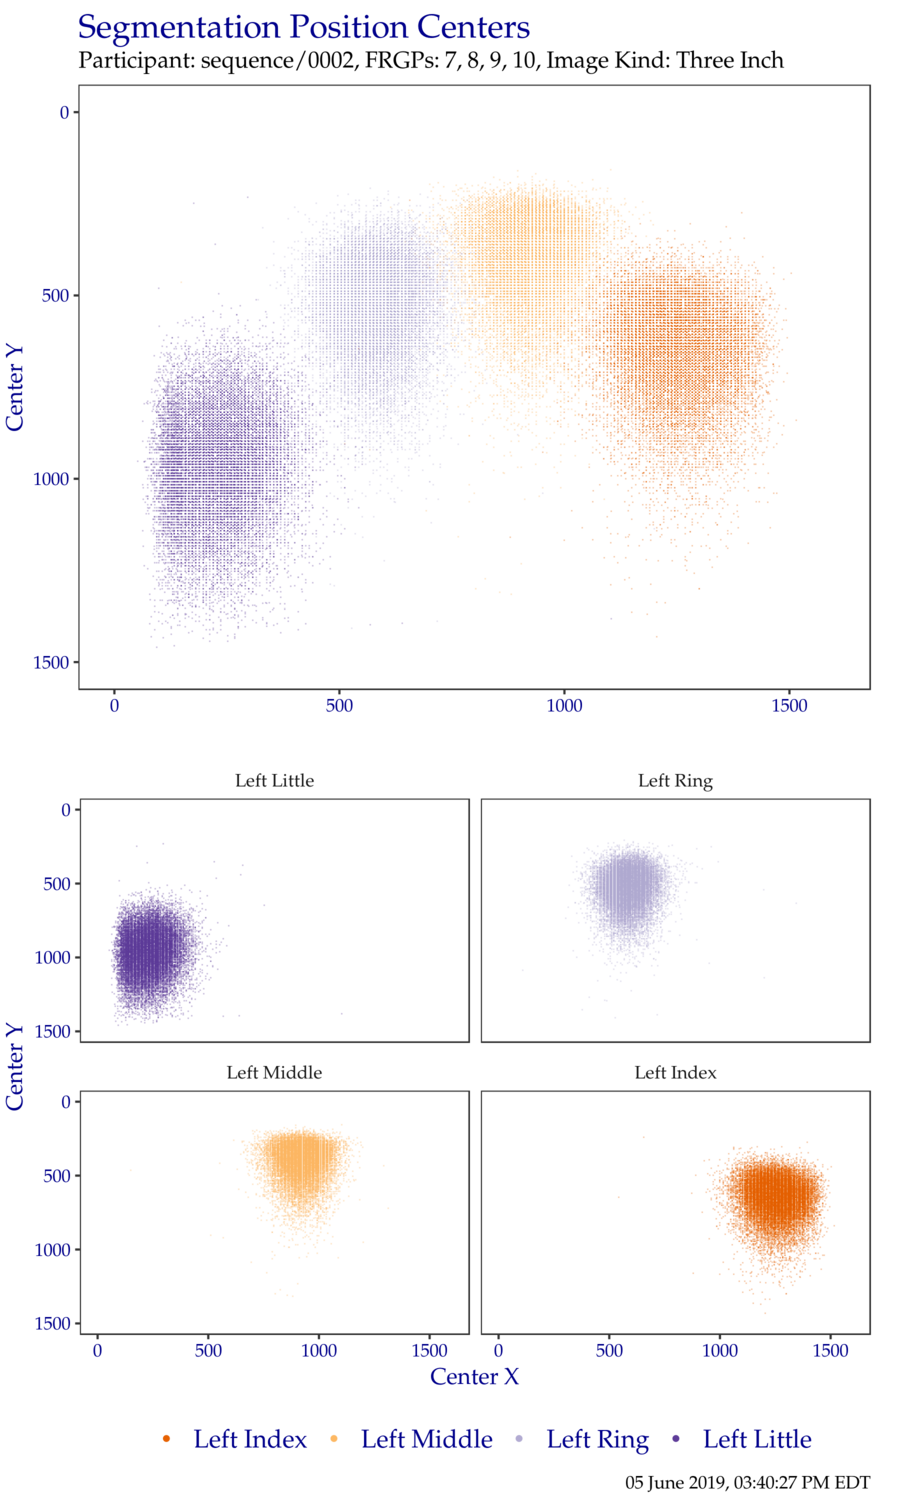
Figure 3.3: Segmentation centers for left hand ThreeInch data.
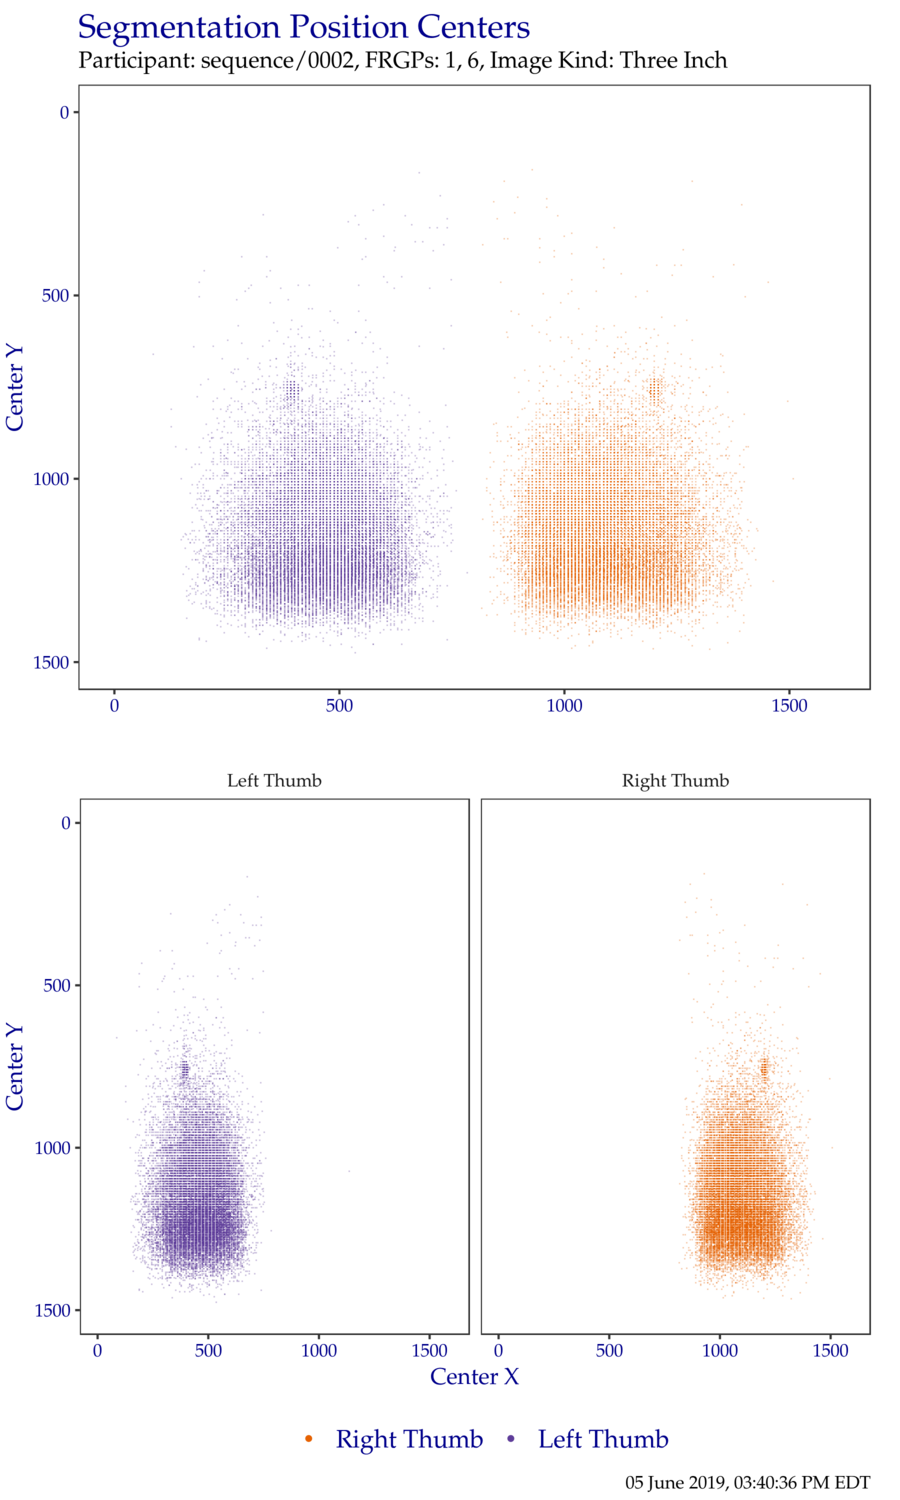
Figure 3.4: Segmentation centers for thumb ThreeInch data.
3.2.2 Segmentation Dimensions
The plots in this section show the distribution of segmentation position widths and heights for ThreeInch data. At the top of each figure is a combined plot for all finger positions of a given hand orientation. These figures are isolated in plots faceted at the bottom of the figure.
Plots of segmentation position dimensions for the right hand ThreeInch data are shown in Figure 3.6, for the left hand in Figure 3.5, and for thumbs in Figure 3.7. Blank lines that may appear in the plots are not rendering artifacts. Rather, they are indicative of image downsampling. Dimensions have been normalized to 500 pixels per inch.
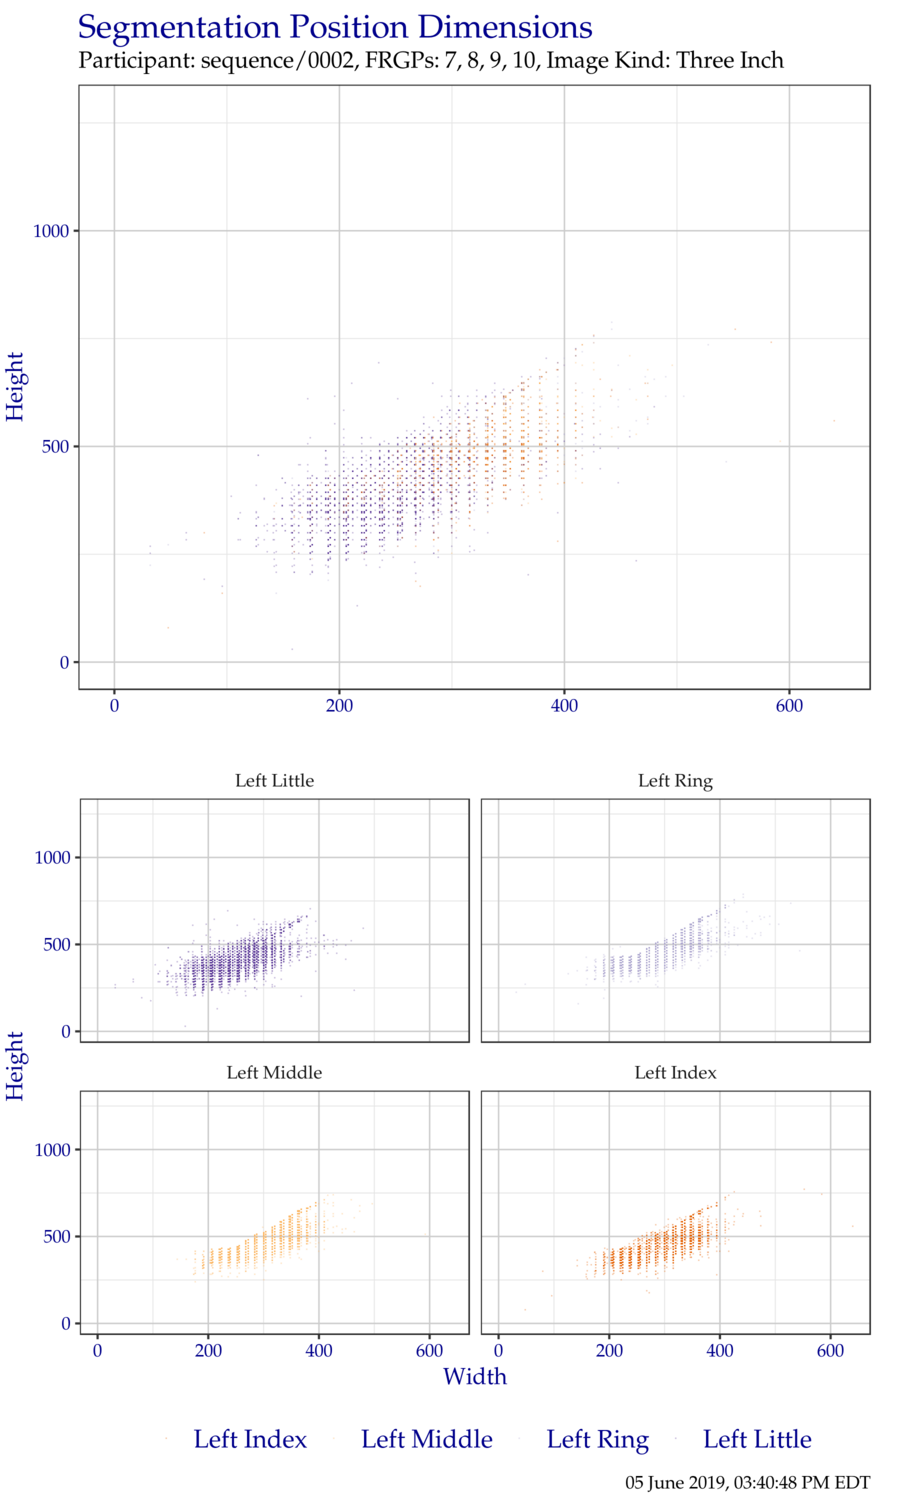
Figure 3.5: Segmentation position dimensions for left hand ThreeInch data.
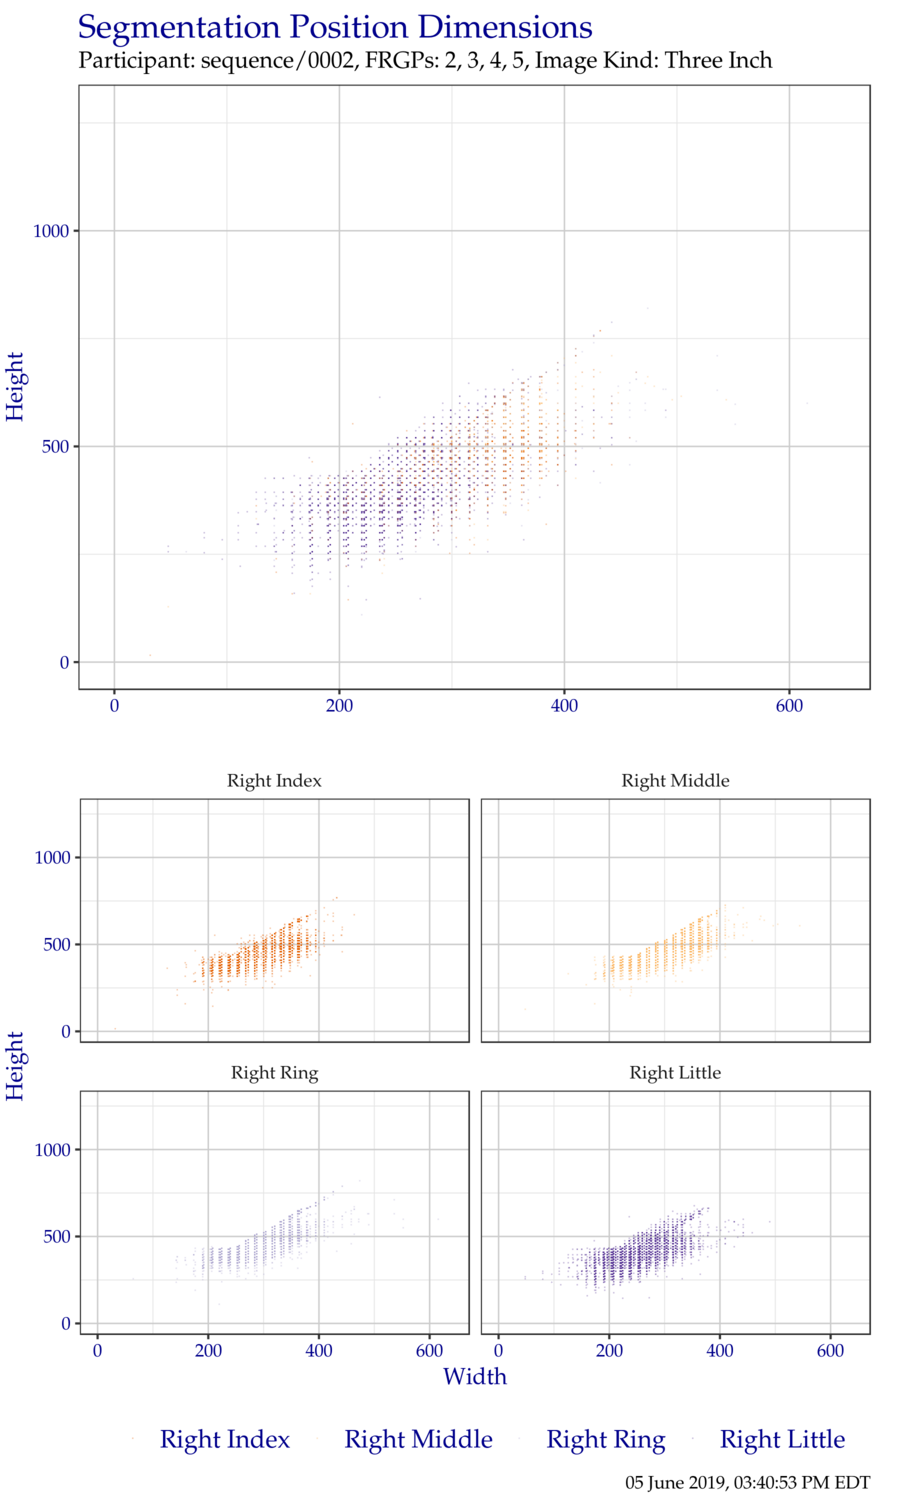
Figure 3.6: Segmentation position dimensions for right hand ThreeInch data.
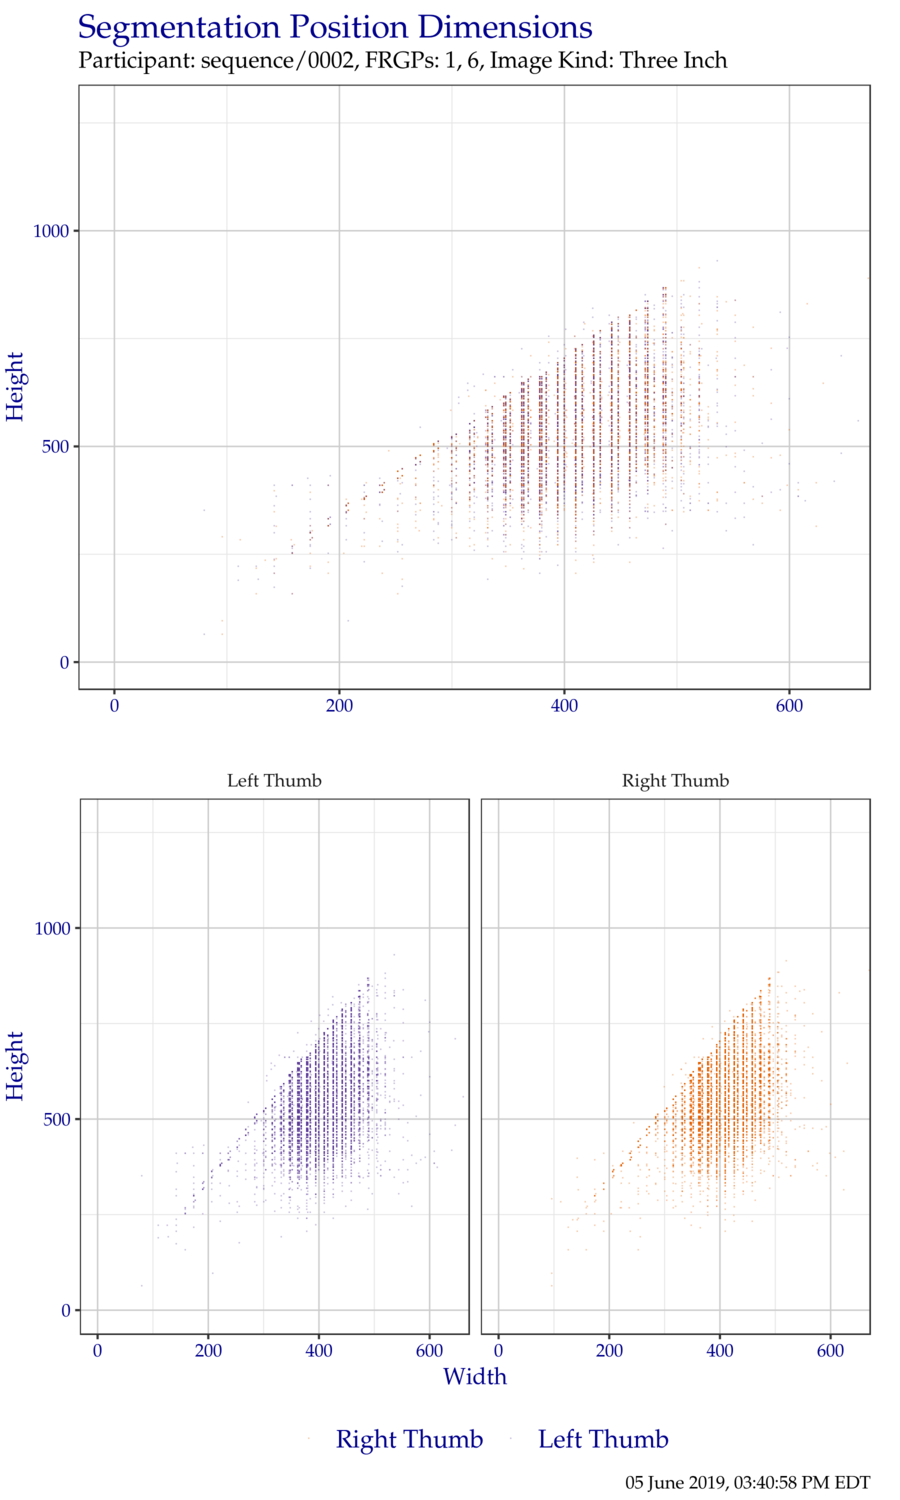
Figure 3.7: Segmentation position dimensions for thumb ThreeInch data.
3.3 Detailed Segmentation Statistics
This section shows detailed results of segmentation of ThreeInch data. Values in each table are the percentage that the variable in the left-most column was correctly segmented.
Each table has three columns of percentages. The Standard Scoring column shows the percentage of correctly-segmented positions based on the scoring metrics defined in the SlapSeg III scoring document. The Ignoring Bottom Y column shows how the percentage would change if the threshold for the bottom Y coordinate of the segmentation position was ignored. Similarly, the Ignoring Bottom X and Y columns shows how the percentage would change if only the top, left, and right sides of the segmentation position were considered. These two supplemental columns are included because it has traditionally been difficult to determine the exact location of the distal interphalangeal joint.
Table 3.2 shows how successful sequence+0002 segmented fingers for each subject in the test corpus. Table 3.3 shows success for specific finger positions over the entire test corpus. Similarly, Table 3.4 shows success for segmenting the same finger position from both hands.
The remainder of the tables show success per subject when considering combinations of subsets of the fingers on each slap image. Table 3.5 shows success for combinations of all fingers, Table 3.6 for just the index and middle fingers, and Table 3.7 for all except the little finger.
| Number of Fingers | Standard Scoring | Ignoring Bottom Y | Ignoring Bottom X and Y |
|---|---|---|---|
| 1 | 99.8 | 99.8 | 99.8 |
| 2 | 99.4 | 99.5 | 99.6 |
| 3 | 98.2 | 98.3 | 98.4 |
| 4 | 97.6 | 97.9 | 98.1 |
| 5 | 95.6 | 95.8 | 95.9 |
| 6 | 94.9 | 95.6 | 95.8 |
| 7 | 93.3 | 95.1 | 95.5 |
| 8 | 88.7 | 93.6 | 95.0 |
| 9 | 75.6 | 88.5 | 92.2 |
| 10 | 50.3 | 70.3 | 79.1 |
| Finger | Standard Scoring | Ignoring Bottom Y | Ignoring Bottom X and Y |
|---|---|---|---|
| Right | |||
| Thumb | 82.4 | 94.9 | 95.3 |
| Index | 97.2 | 98.2 | 98.8 |
| Middle | 94.8 | 97.3 | 99.0 |
| Ring | 92.5 | 95.2 | 97.8 |
| Little | 95.0 | 96.4 | 97.4 |
| Left | |||
| Thumb | 80.1 | 96.0 | 96.4 |
| Index | 95.8 | 96.8 | 97.6 |
| Middle | 93.7 | 96.2 | 98.7 |
| Ring | 91.4 | 93.3 | 97.4 |
| Little | 95.0 | 96.1 | 97.1 |
| Fingers | Standard Scoring | Ignoring Bottom Y | Ignoring Bottom X and Y |
|---|---|---|---|
| Thumb | |||
| Either | 90.8 | 99.1 | 99.2 |
| Both | 71.7 | 91.9 | 92.6 |
| Index | |||
| Either | 99.2 | 99.5 | 99.7 |
| Both | 91.2 | 92.9 | 94.2 |
| Middle | |||
| Either | 98.4 | 99.2 | 99.7 |
| Both | 87.7 | 91.7 | 95.4 |
| Ring | |||
| Either | 97.7 | 98.5 | 99.5 |
| Both | 83.8 | 87.5 | 93.1 |
| Little | |||
| Either | 99.0 | 99.3 | 99.5 |
| Both | 88.4 | 90.6 | 92.3 |
| Fingers | Standard Scoring | Ignoring Bottom Y | Ignoring Bottom X and Y |
|---|---|---|---|
| Right | |||
| Any | 99.6 | 99.7 | 99.7 |
| At Least Two | 98.2 | 98.4 | 98.4 |
| At Least Three | 97.0 | 98.0 | 98.2 |
| At Least Four | 92.1 | 95.9 | 97.1 |
| All Five | 66.6 | 81.1 | 86.0 |
| Left | |||
| Any | 99.6 | 99.7 | 99.8 |
| At Least Two | 98.1 | 98.3 | 98.3 |
| At Least Three | 96.6 | 97.7 | 98.0 |
| At Least Four | 90.6 | 94.8 | 96.6 |
| All Five | 62.8 | 79.0 | 85.4 |
| Fingers | Standard Scoring | Ignoring Bottom Y | Ignoring Bottom X and Y |
|---|---|---|---|
| Right | |||
| Either | 99.2 | 99.6 | 99.7 |
| Both | 92.7 | 95.8 | 98.1 |
| Left | |||
| Either | 98.9 | 99.3 | 99.6 |
| Both | 90.6 | 93.8 | 96.7 |
| Fingers | Standard Scoring | Ignoring Bottom Y | Ignoring Bottom X and Y |
|---|---|---|---|
| Right | |||
| Any | 99.6 | 99.8 | 99.8 |
| At Least Two | 97.6 | 98.8 | 99.5 |
| All Three | 87.2 | 92.2 | 96.4 |
| Left | |||
| Any | 99.4 | 99.6 | 99.7 |
| At Least Two | 96.7 | 97.9 | 99.1 |
| All Three | 84.8 | 88.8 | 94.8 |
3.4 Handling Troublesome Images
3.4.1 Capture Failures
Segmentation algorithms may refuse to process an image. This may happen for a technical reason (e.g., the algorithm cannot parse the image data), or for a practical reason (e.g., the hand in the image is placed incorrectly). These failure scenarios are the result of capturing improper image data. In these types of scenarios, it is important to examine the cause of the failure. With many live scan capture setups, segmentation is performed immediately after capture. If an algorithm can detect that it won’t be able to segment an image due to a technical or practical issue, it can alert the operator to perform a recapture before the subject leaves.
The SlapSeg III API encourages algorithms to identify these failure reasons by specifying pre-defined deficiencies in the image. Algorithms should attempt segmentation even if an image deficiency is encountered if at all possible. Note that SlapSeg III guarantees well-formed image data, so failures to parse are not an indicator of the data provided.
Reasons for capture-type failures reported by sequence+0002 are enumerated in Table 3.8.
| Failure Reason | Images |
|---|---|
| Request Recapture (Attempt) | 119 |
In situations where the algorithm feels that the presented image should be recaptured (Table 3.8), one or more image deficiencies must be identified. These deficiencies are enumerated in Table 3.9. At this point, NIST does not have a groundtruth of image deficiencies, but plans to update this table with the accuracy of deficiency observations in the future.
| Deficiency | Count |
|---|---|
| Image Quality | 119 |
3.4.1.1 Recovery
When encountering a segmentation failure, SlapSeg III algorithms are encouraged to provide a best-effort segmentation when possible. In some cases, that best-effort may be correct, which reduces the amount of images that need to be manually adjudicated by an operator.The result of such best-effort segmentations are shown in Table 3.10.
Out of 119 recovery attemptssequence+0002 attempted 327 segmentations of fingers and skipped 145 fingers. More information about skipped fingers can be found in Table 3.11.
| Standard | Ignoring Bottom Y | Ignoring Bottom X and Y |
|---|---|---|
| 55.7 | 58.4 | 61.8 |
3.4.2 Segmentation Failures
Even if an algorithm accepts an image for processing, it can still fail to process one or more fingers from the image, regardless of if the algorithm requested a recapture and provided best-effort segmentation.
The SlapSeg III API allows algorithms to communicate reasons for failure to process these fingers. In some cases, the distal phalanx in question might not be present in the image due to amputation or being placed outside the platen’s capture area. It is imperative that the segmentation algorithm correctly report this as failing to segment the correct friction ridge generalized position without disrupting the sequence of valid positions present in the image. This can help prompt an operator to recapture or record additional information about the subject.
In SlapSeg III, a number of images are missing fingers or otherwise have fingers that will not be able to be segmented. Reasons for segmentation failures reported by sequence+0002 are enumerated in Table 3.11.
| Failure Reason | Fingers |
|---|---|
| Finger Found, but Can’t Segment | 145 |
| Finger Not Found | 0 |
| Vendor Defined | 0 |
3.4.3 Identifying Missing Fingers
A small portion of the test corpus in SlapSeg III are missing fingers. Table 3.12 shows how successful sequence+0002 was in correctly determining if a finger was missing. The Missed row shows when a segmentation position was returned for a missing finger. All possible failure reasons are enumerated, but are not considered Correctly Identified because the algorithm specified failure for a reason other than the finger not being found.
| Result | Percentage |
|---|---|
| Missed | 65.0 |
| Correctly Identified | 0.0 |
| Other Failure: Finger Found, but Can’t Segment | 35.0 |
| Other Failure: Vendor Defined | 0.0 |
| Other Failure: Segmentation Not Attempted | 0.0 |
3.4.4 Sequence Error
Sequence error occurs when a fingerprint is segmented from an image but assigned an incorrect finger position (e.g., segmenting a right middle finger but labeling it a right index finger). Table 3.13 shows cases in which a segmentation position was returned that matched a ground truth segmentation position for a different finger in the same image.
| Hand | Standard Scoring | Ignoring Bottom Y | Ignoring Bottom X and Y |
|---|---|---|---|
| Left | 0.06 | 0.06 | 0.07 |
| Right | 0.07 | 0.07 | 0.07 |
| Thumbs | 0.03 | 0.03 | 0.03 |
| Combined | 0.06 | 0.06 | 0.06 |
3.5 Determining Orientation
An optional portion of the SlapSeg III API asked participants to determine the hand orientation of an image. Participants were provided the kind (e.g., Identification Flat) and needed to determine whether the image was of the left hand, right hand, or thumbs.
Overall Three Inch accuracy: 97.7%| Left | Right | Skip | Thumbs | |
|---|---|---|---|---|
| Left | 99.3 | 0.6 | 0 | 0.1 |
| Right | 0.8 | 99.2 | 0 | 0 |
| Thumbs | 3 | 2.5 | 0 | 94.5 |