4 Comparison to PFT II
The PFT II evaluation ran at NIST from February 2010 until May 2019. The plots and tables in this section use identical datasets and comparison pairs as PFT II and are directly comparable to results posted on the NIST website for PFT II:
https://nist.gov/itl/iad/image-group/proprietary-fingerprint-template-evaluation-pftii
4.1 All Fingers
Figure 4.1 and Table 4.1 shows the DET of all fingers for each dataset evaluated in PFT II. Curves are linked at equivalent score thresholds for specific false match rates on the best performing dataset.
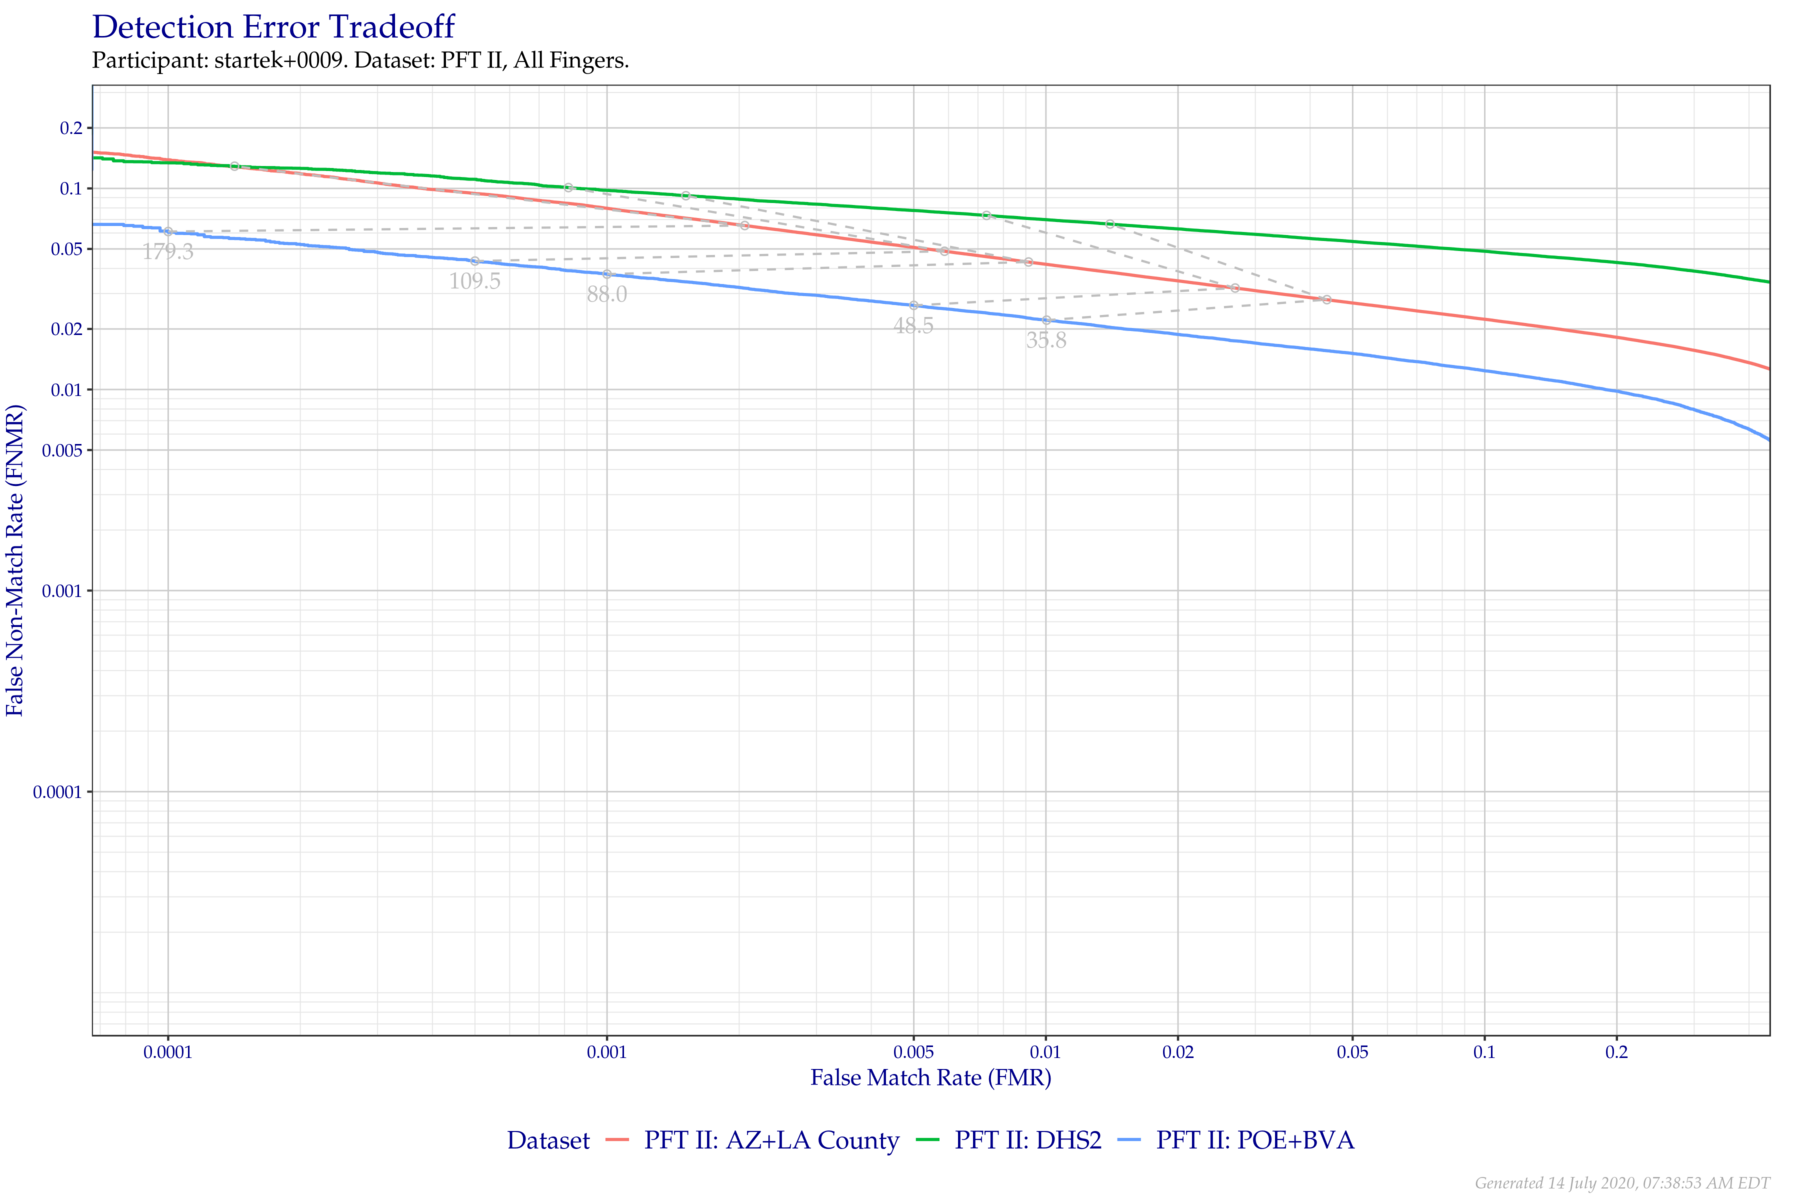
Figure 4.1: Detection error tradeoff of all comparisons from all fingers in PFT II, separated by dataset. Curves are linked at equivalent score thresholds.
| Dataset | FNMR @ FMR = 0.0001 | FNMR @ FMR = 0.001 | FNMR @ FMR = 0.01 |
|---|---|---|---|
| PFT II: AZ+LA County | 0.1389 | 0.0797 | 0.0420 |
| PFT II: DHS2 | 0.1341 | 0.0978 | 0.0700 |
| PFT II: POE+BVA | 0.0610 | 0.0375 | 0.0222 |
4.2 Index Fingers
Figure 4.2 and Table 4.2 show the DET of index fingers over the three datasets evaluated in PFT II. Combined finger positions were generated by sum fusion.
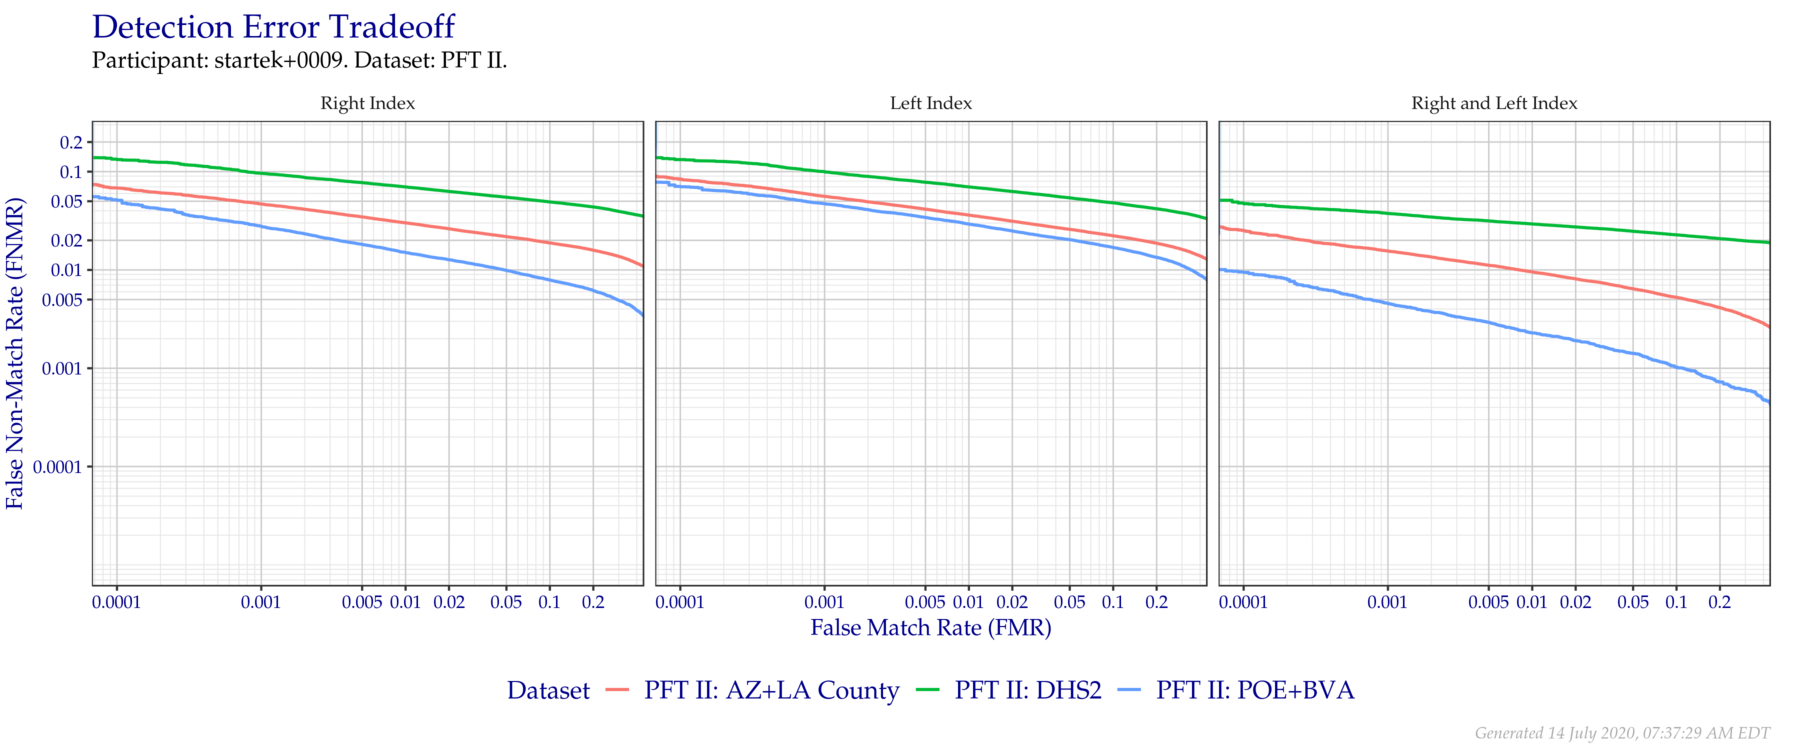
Figure 4.2: Detection error tradeoff of index fingers compared in PFT II. Combined finger positions were generated by sum fusion.
| FRGP | FNMR @ FMR = 0.0001 | FNMR @ FMR = 0.001 | FNMR @ FMR = 0.01 |
|---|---|---|---|
| PFT II: AZ+LA County | |||
| R Index | 0.0684 | 0.0469 | 0.0301 |
| L Index | 0.0839 | 0.0561 | 0.0362 |
| R & L Index | 0.0252 | 0.0156 | 0.0096 |
| PFT II: DHS2 | |||
| R Index | 0.1339 | 0.0961 | 0.0699 |
| L Index | 0.1326 | 0.0999 | 0.0700 |
| R & L Index | 0.0480 | 0.0376 | 0.0294 |
| PFT II: POE+BVA | |||
| R Index | 0.0518 | 0.0279 | 0.0150 |
| L Index | 0.0707 | 0.0472 | 0.0293 |
| R & L Index | 0.0095 | 0.0046 | 0.0023 |
4.3 Arizona/Los Angeles County
Figure 4.3 and Table 4.3 show the DET of all finger combinations compared in PFT II’s evaluation of the combined datasets from the Arizona Department of Public Safety and the Los Angeles County Sheriff’s Department. Curves in each dataset are separated by the impression types compared. Combined finger positions were generated by sum fusion.
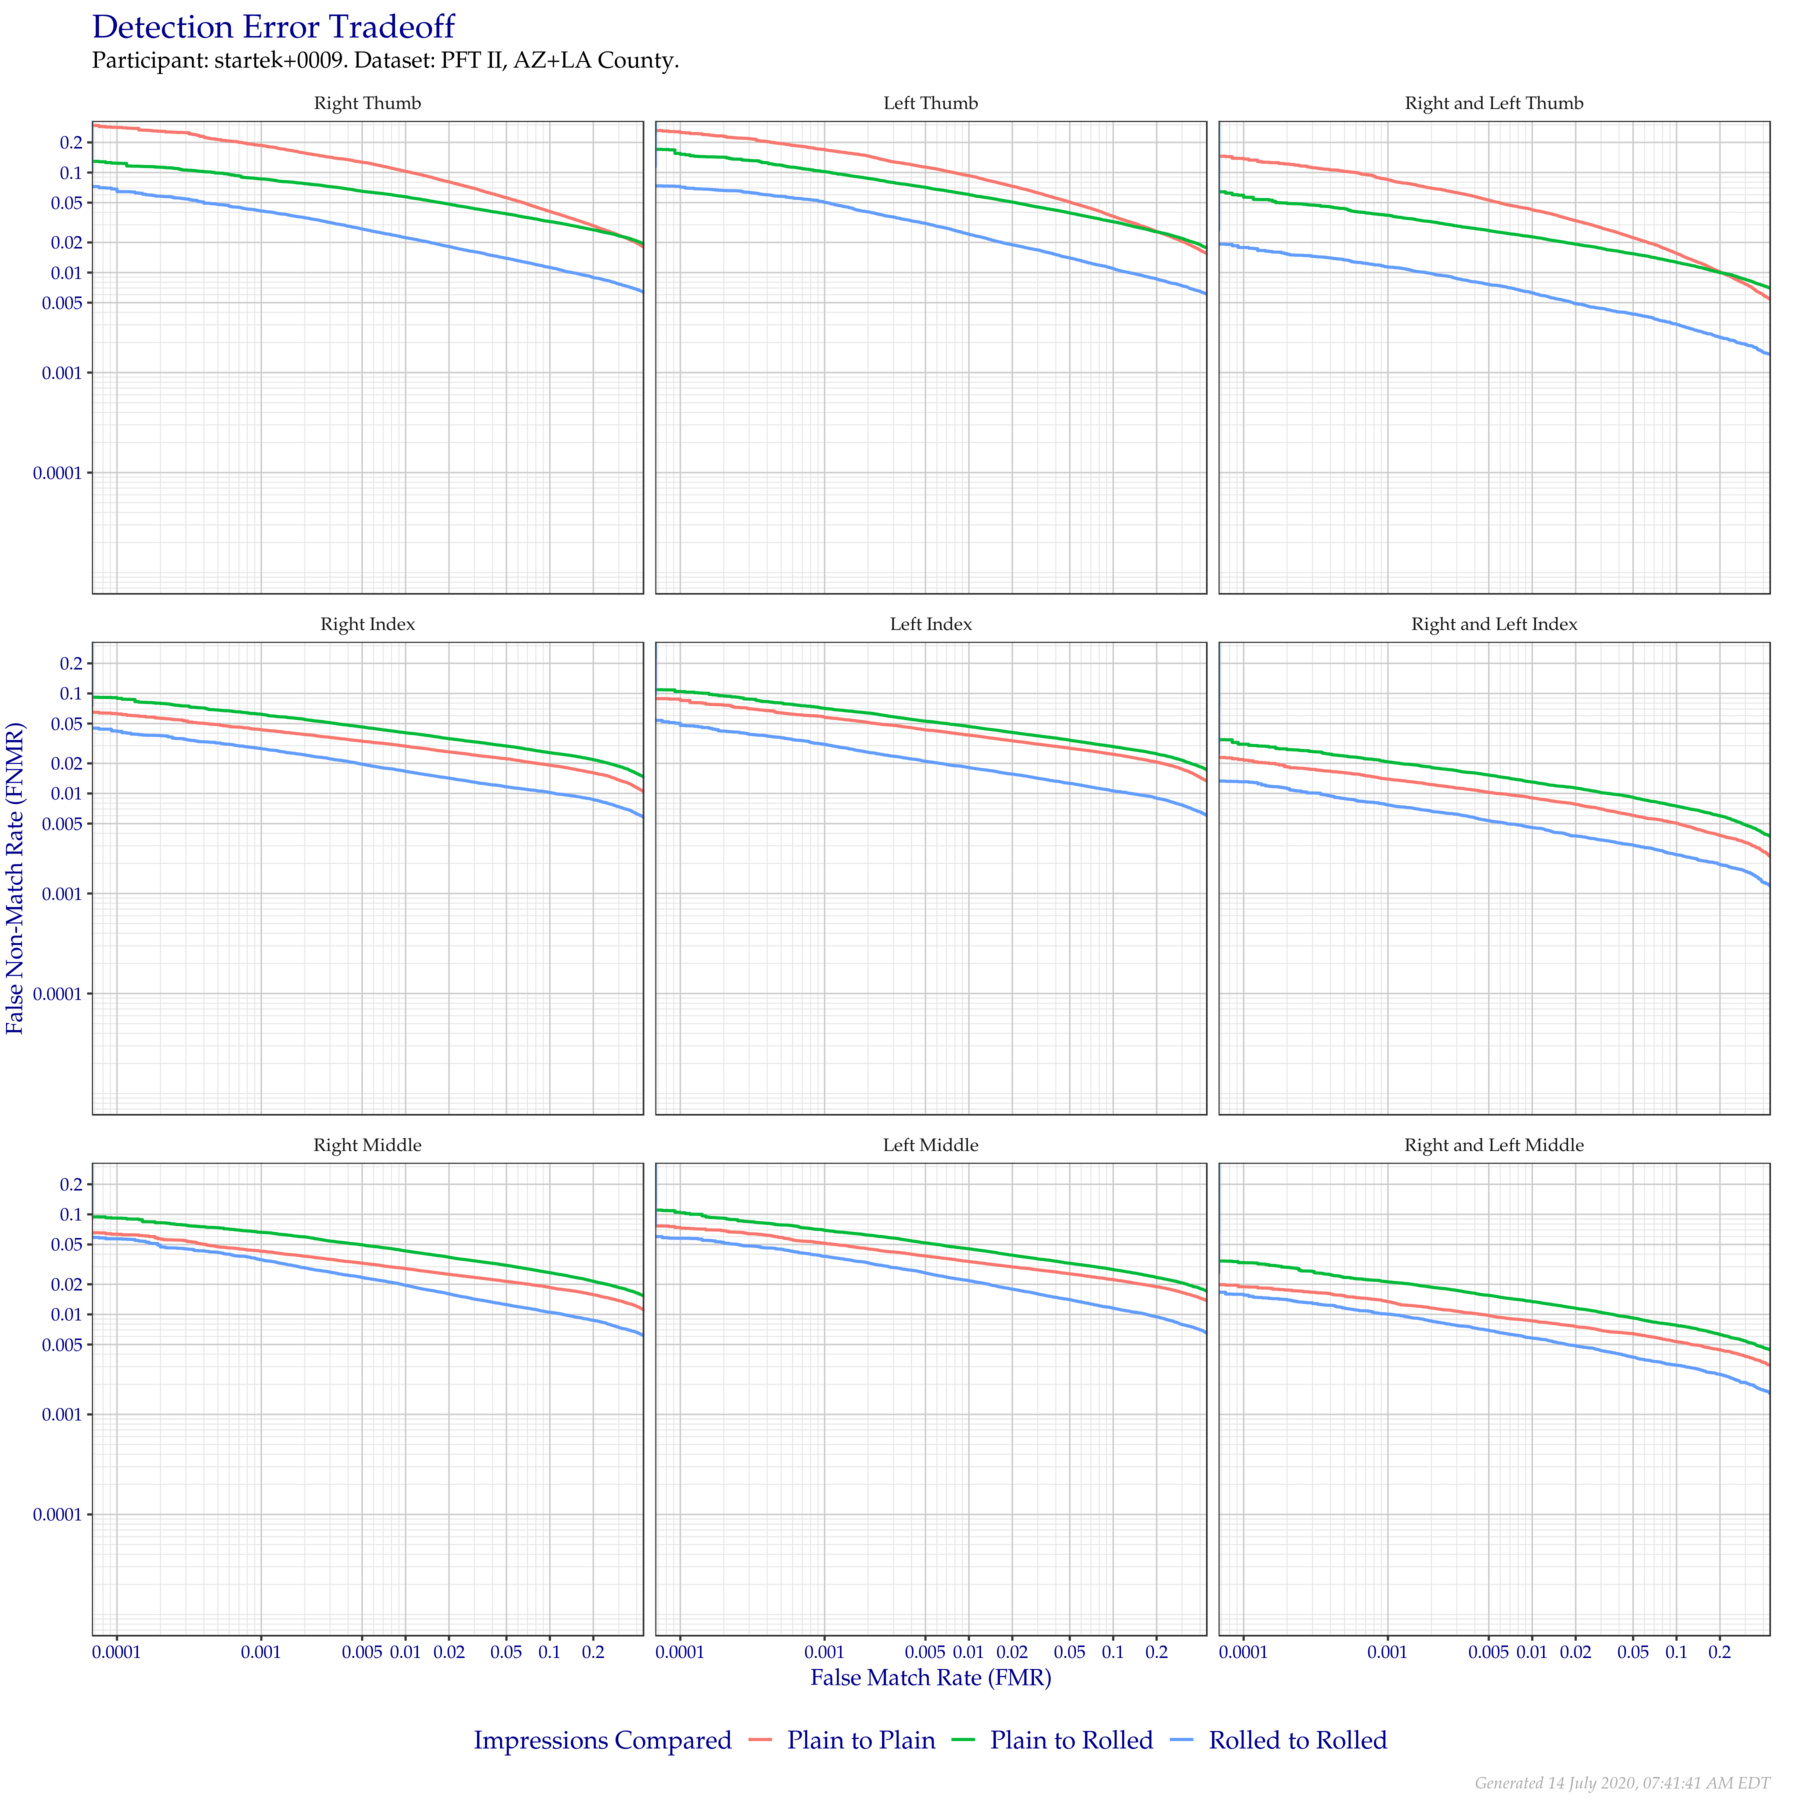
Figure 4.3: Detection error tradeoff of comparisons from the PFT II AZ/LA dataset, separated by impression type. Combined finger positions were generated by sum fusion.
| FRGP | FNMR @ FMR = 0.0001 | FNMR @ FMR = 0.001 | FNMR @ FMR = 0.01 |
|---|---|---|---|
| Plain to Plain | |||
| R Thumb | 0.2831 | 0.1871 | 0.1029 |
| R Index | 0.0630 | 0.0435 | 0.0297 |
| R Middle | 0.0634 | 0.0428 | 0.0287 |
| L Thumb | 0.2535 | 0.1700 | 0.0932 |
| L Index | 0.0860 | 0.0578 | 0.0383 |
| L Middle | 0.0736 | 0.0513 | 0.0338 |
| R & L Thumb | 0.1380 | 0.0852 | 0.0425 |
| R & L Index | 0.0218 | 0.0139 | 0.0090 |
| R & L Middle | 0.0189 | 0.0134 | 0.0086 |
| Plain to Rolled | |||
| R Thumb | 0.1256 | 0.0864 | 0.0573 |
| R Index | 0.0901 | 0.0621 | 0.0405 |
| R Middle | 0.0918 | 0.0662 | 0.0431 |
| L Thumb | 0.1533 | 0.1022 | 0.0603 |
| L Index | 0.1045 | 0.0711 | 0.0468 |
| L Middle | 0.1050 | 0.0694 | 0.0454 |
| R & L Thumb | 0.0600 | 0.0374 | 0.0228 |
| R & L Index | 0.0324 | 0.0208 | 0.0130 |
| R & L Middle | 0.0338 | 0.0212 | 0.0135 |
| Rolled to Rolled | |||
| R Thumb | 0.0694 | 0.0414 | 0.0223 |
| R Index | 0.0423 | 0.0282 | 0.0167 |
| R Middle | 0.0570 | 0.0353 | 0.0195 |
| L Thumb | 0.0727 | 0.0504 | 0.0242 |
| L Index | 0.0483 | 0.0310 | 0.0182 |
| L Middle | 0.0577 | 0.0381 | 0.0218 |
| R & L Thumb | 0.0178 | 0.0114 | 0.0063 |
| R & L Index | 0.0132 | 0.0077 | 0.0046 |
| R & L Middle | 0.0159 | 0.0101 | 0.0058 |