2 Timing Sample Dataset
A fixed sample of images randomly selected from the PFT III datasets are used to assess whether or not an implementation adheres to the minimum timing requirements set forth in the PFT III test plan. This sample is also used to provide an estimate on template size. The images and comparisons are identical to the “1K Sample Evaluation” from NIST’s PFT II evaluation, with the exception of the “IARPA N2N” dataset, which is new in PFT III. Table 2.1 shows information about the maximum dimensions and resolutions of the images in each of the timing sample datasets.
| AZ | LA County | DHS 2 | POE+BVA | IARPA N2N | |
|---|---|---|---|---|---|
| Max Dimensions (pixels) | 800 x 800 | 412 x 1 000 | 368 x 368 | 500 x 500 | 1 600 x 1 500 |
| Resolution (PPI) | 500 | 500 | 500 | 500 | 1 000 |
2.1 Template Size
Figure 2.1 and Table 2.2 show the distribution of file sizes of templates. Failures of any kind reported during template generation result in NIST code writing 0 byte files. These files are excluded from the template size analysis in this section.
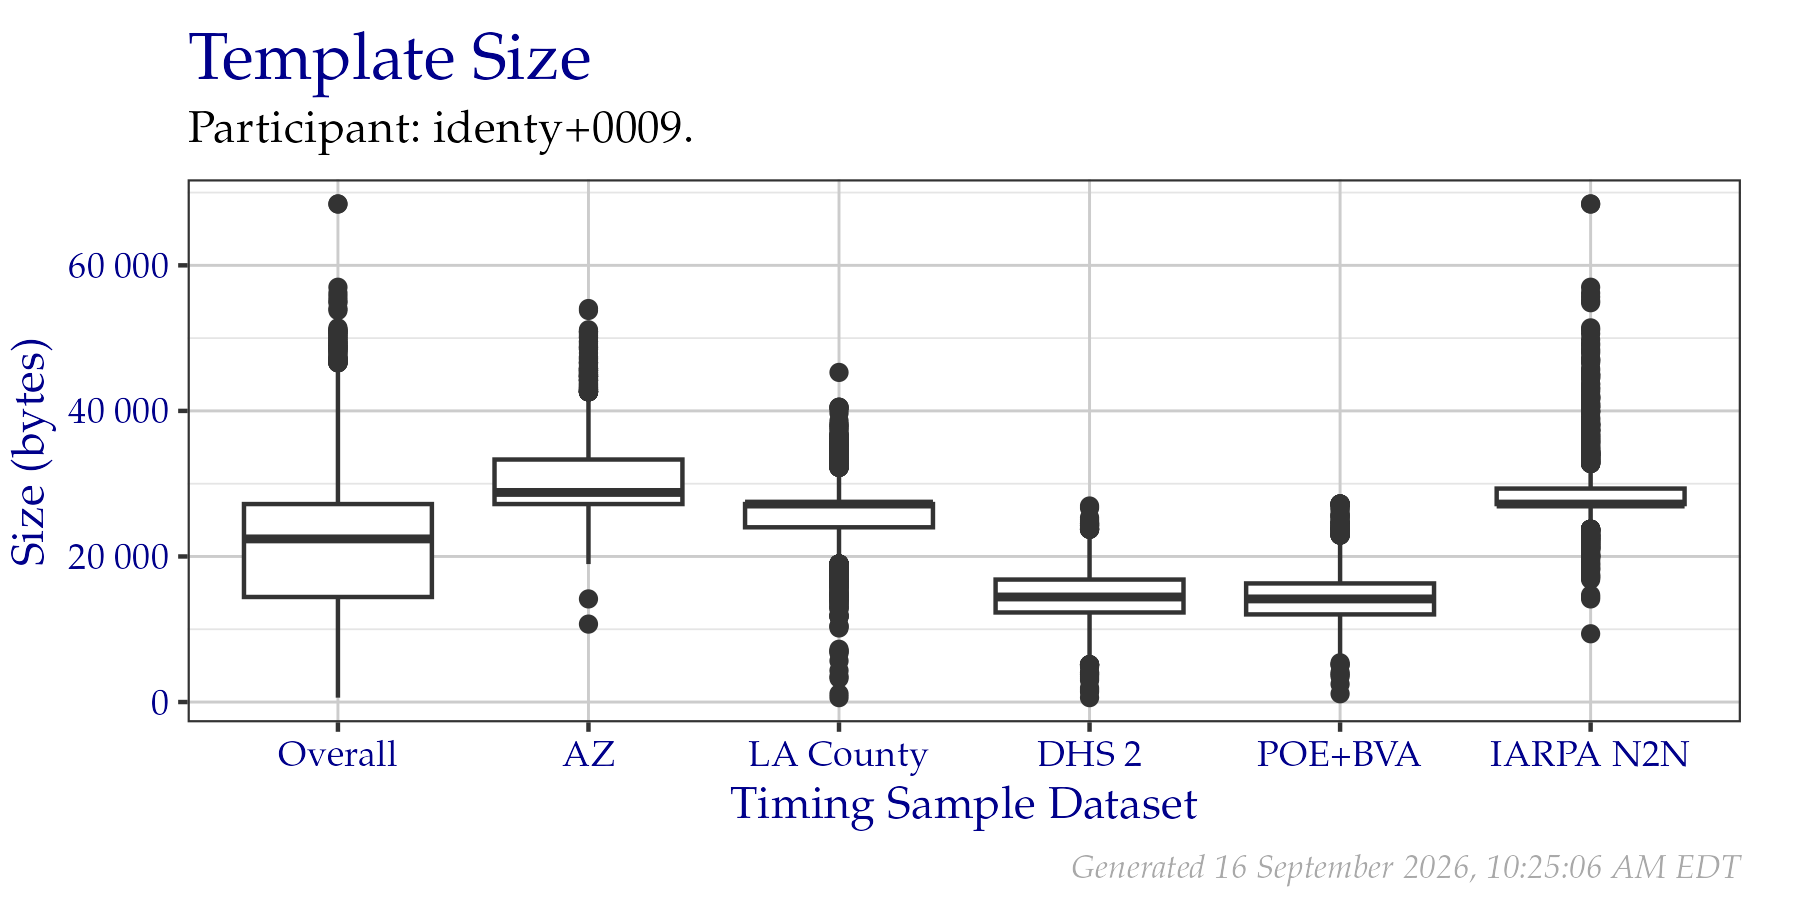
Figure 2.1: Box plots of template sizes in bytes of templates created from a fixed sample of data from the PFT III evaluation. An overall plot is shown, as well as individual plots per data origin. Tabular versions of this data are shown in Table 2.2.
| Overall | AZ | LA County | DHS 2 | POE+BVA | IARPA N2N | |
|---|---|---|---|---|---|---|
| Min | 601 | 10 709 | 601 | 601 | 1 133 | 9 379 |
| 25 % | 14 433 | 27 201 | 24 009 | 12 305 | 12 039 | 27 201 |
| Median | 22 413 | 28 797 | 27 201 | 14 433 | 14 167 | 27 201 |
| Mean | 21 885 | 30 729 | 25 770 | 14 458 | 14 299 | 28 747 |
| 75 % | 27 201 | 33 319 | 27 201 | 16 827 | 16 295 | 29 329 |
| Max | 68 431 | 54 067 | 45 289 | 26 935 | 27 201 | 68 431 |
| Failures | 0 | 0 | 0 | 0 | 0 | 0 |
2.2 Template Creation Time
Figure 2.2 and Table 2.3 show the distribution of durations of time consumed when creating templates. Failures of all kinds are incorporated into these statistics, since this time would be observed by the end user of a template creation algorithm.
Times are measured by running a single process on an isolated compute node equipped with an Intel Xeon Gold 6254 CPU.
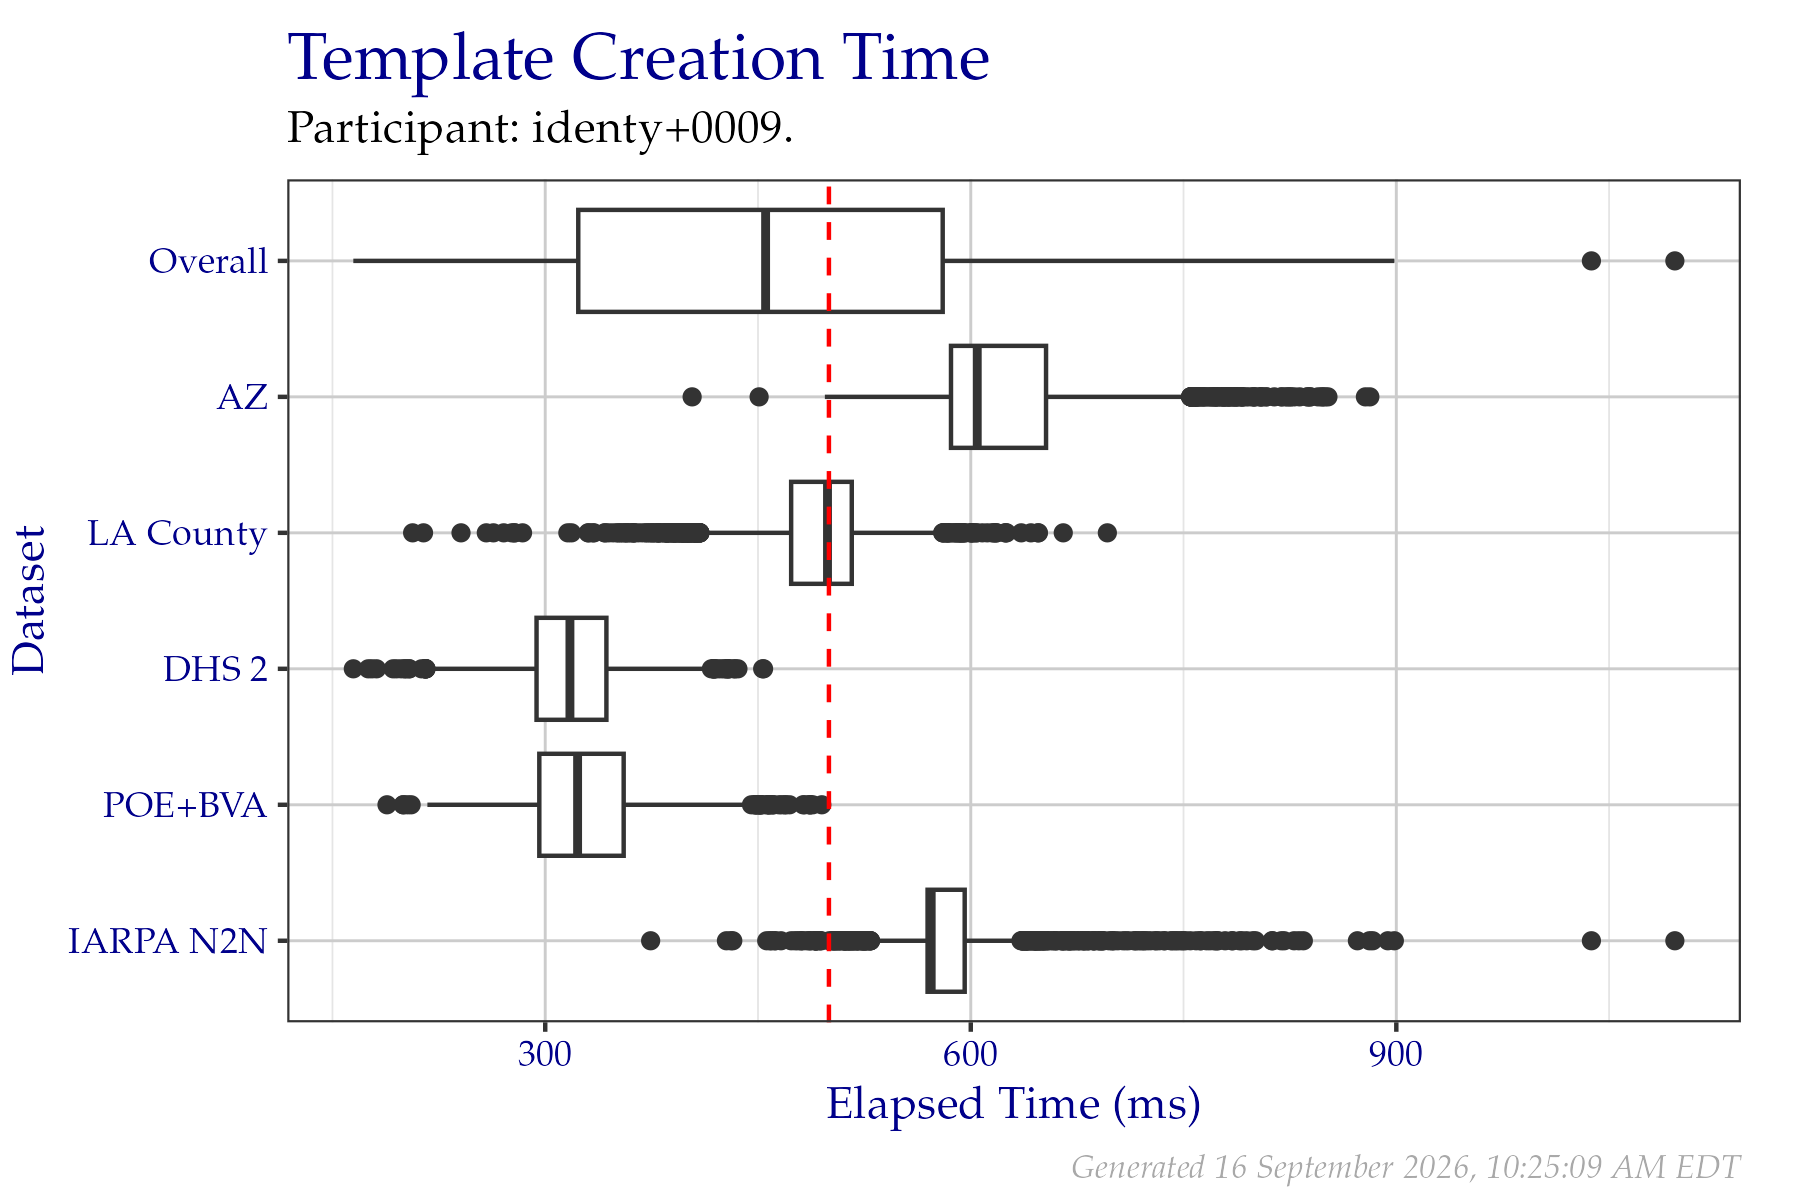
Figure 2.2: Box plots of elapsed milliseconds when creating templates from a fixed sample of data from the PFT III evaluation. All times are used, even if a failure occurred. Tabular versions of this data are shown in Table 2.3.
| Overall | AZ | LA County | DHS 2 | POE+BVA | IARPA N2N | |
|---|---|---|---|---|---|---|
| Min | 164.7 | 403.6 | 206.5 | 164.7 | 188.4 | 374.3 |
| 25 % | 323.3 | 586.1 | 473.4 | 293.9 | 295.8 | 569.5 |
| Median | 455.4 | 604.6 | 499.0 | 317.4 | 322.8 | 572.1 |
| Mean | 451.8 | 625.3 | 490.8 | 318.0 | 327.3 | 589.2 |
| 75 % | 580.2 | 653.1 | 516.1 | 343.1 | 355.3 | 595.7 |
| Max | 1 096.4 | 881.3 | 696.3 | 453.9 | 495.0 | 1 096.4 |
| Failures | 0 | 0 | 0 | 0 | 0 | 0 |
2.3 Template Comparison Time
Figure 2.3 and Table 2.4 show the distribution of durations of time consumed when comparing templates. Failures of any kind are incorporated into these statistics, since this time would be observed by the end user of a template comparison algorithm.
Times are measured by running a single process on an isolated compute node equipped with an Intel Xeon Gold 6254 CPU.
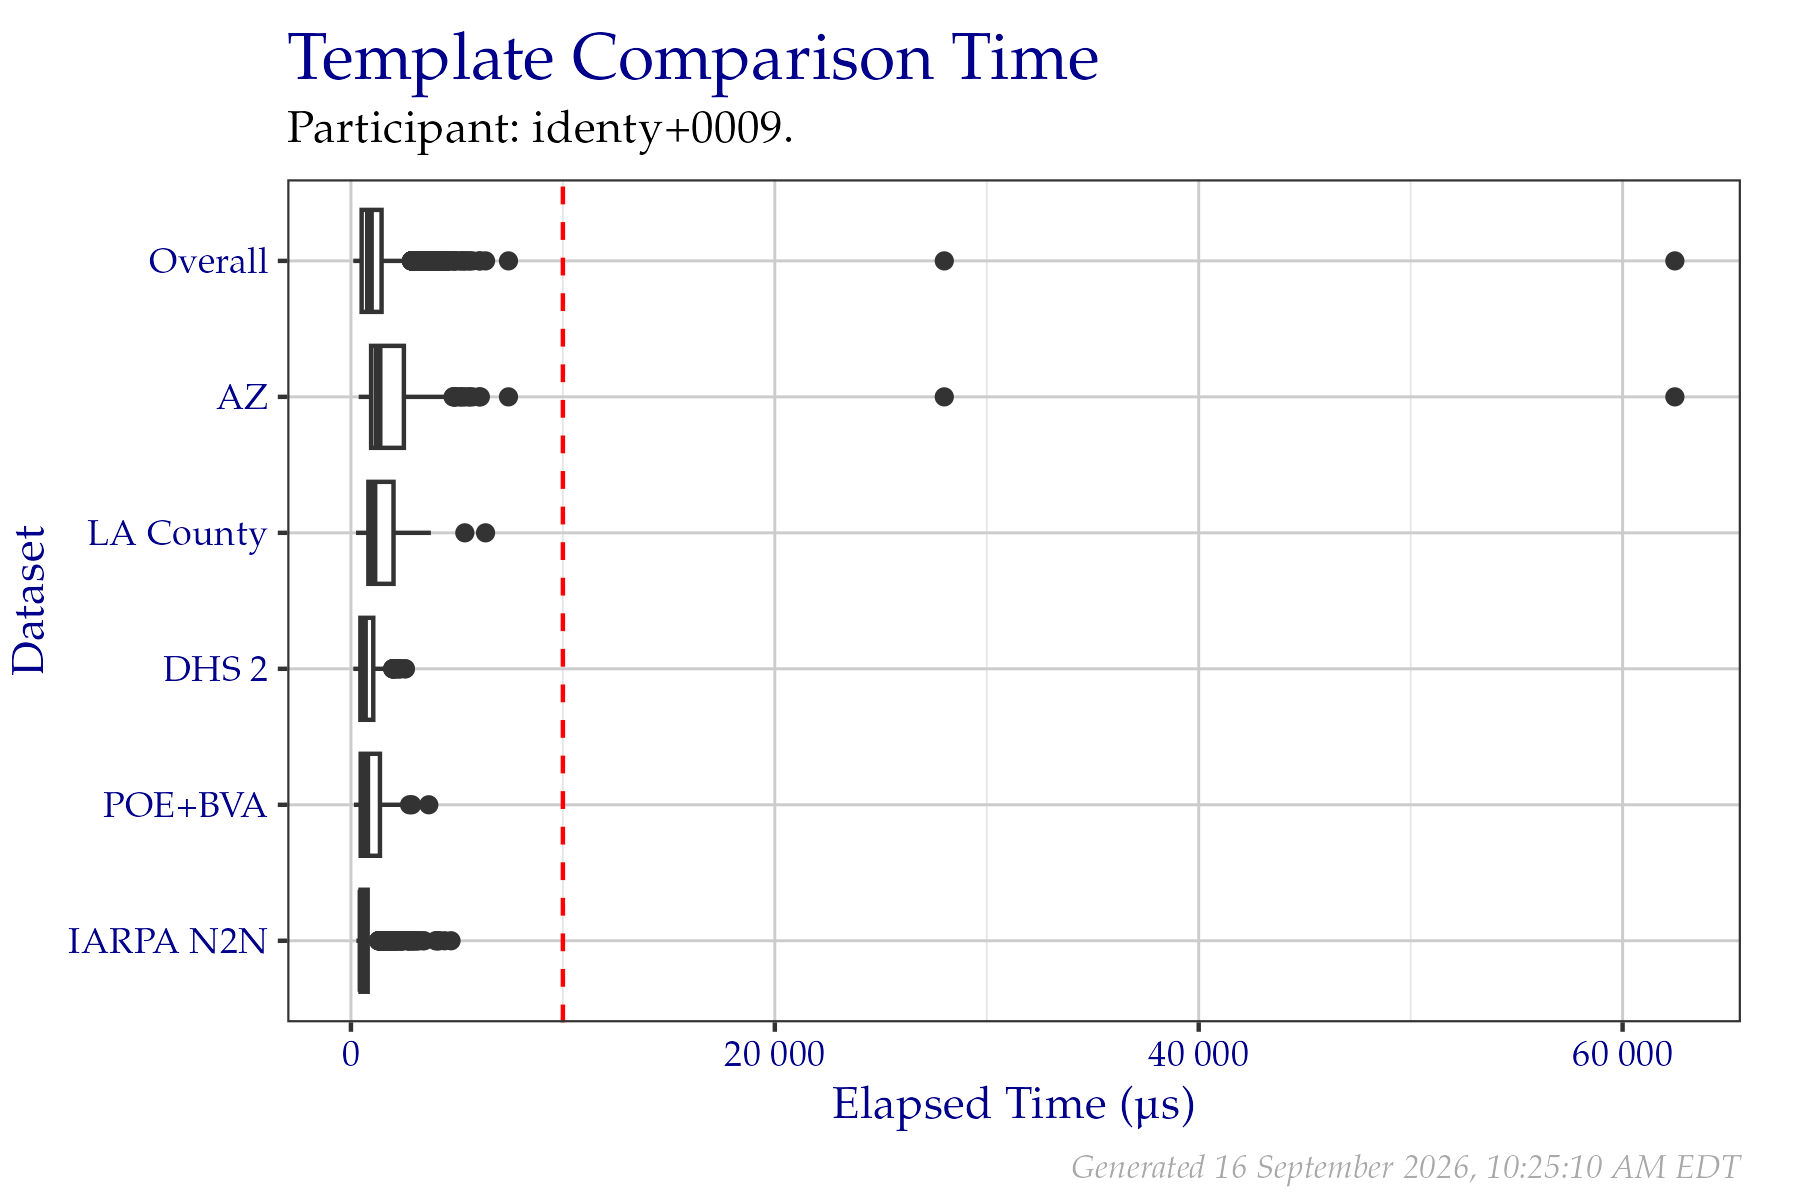
Figure 2.3: Box plots of elapsed microseconds when comparing two templates from a fixed sample of data from the PFT III evaluation. All times are used, even if a failure occurred. Tabular versions of this data are shown in Table 2.4.
| Overall | AZ | LA County | DHS 2 | POE+BVA | IARPA N2N | |
|---|---|---|---|---|---|---|
| Min | 112.4 | 365.9 | 238.8 | 112.4 | 142.1 | 257.1 |
| 25 % | 504.6 | 951.3 | 822.2 | 444.8 | 459.8 | 452.0 |
| Median | 871.7 | 1 279.8 | 1 038.4 | 590.1 | 697.6 | 522.4 |
| Mean | 1 108.2 | 1 760.3 | 1 373.8 | 762.7 | 924.3 | 713.8 |
| 75 % | 1 444.8 | 2 497.5 | 2 008.7 | 1 053.8 | 1 368.7 | 789.2 |
| Max | 62 466.0 | 62 466.0 | 6 350.2 | 2 564.4 | 3 672.9 | 4 722.5 |
| Failures | 0 | 0 | 0 | 0 | 0 | 0 |