5 Comparison to Original PFT
The Original PFT evaluation ran at NIST from 2003 until February 2010. The plots and tables in this section use identical datasets and comparison pairs as the Original PFT evaluation and are directly comparable to results posted for the Original PFT and the “Original PFT Dataset” section in PFT II reports on the NIST website:
https://nist.gov/itl/iad/image-group/nist-proprietary-fingerprint-template-pft-evaluation-2003-2010
5.1 Index Fingers
Figure 5.1 and Table 5.1 show the DET of index fingers over the three datasets evaluated in the Original PFT evaluation. Combined finger positions were generated by sum fusion.
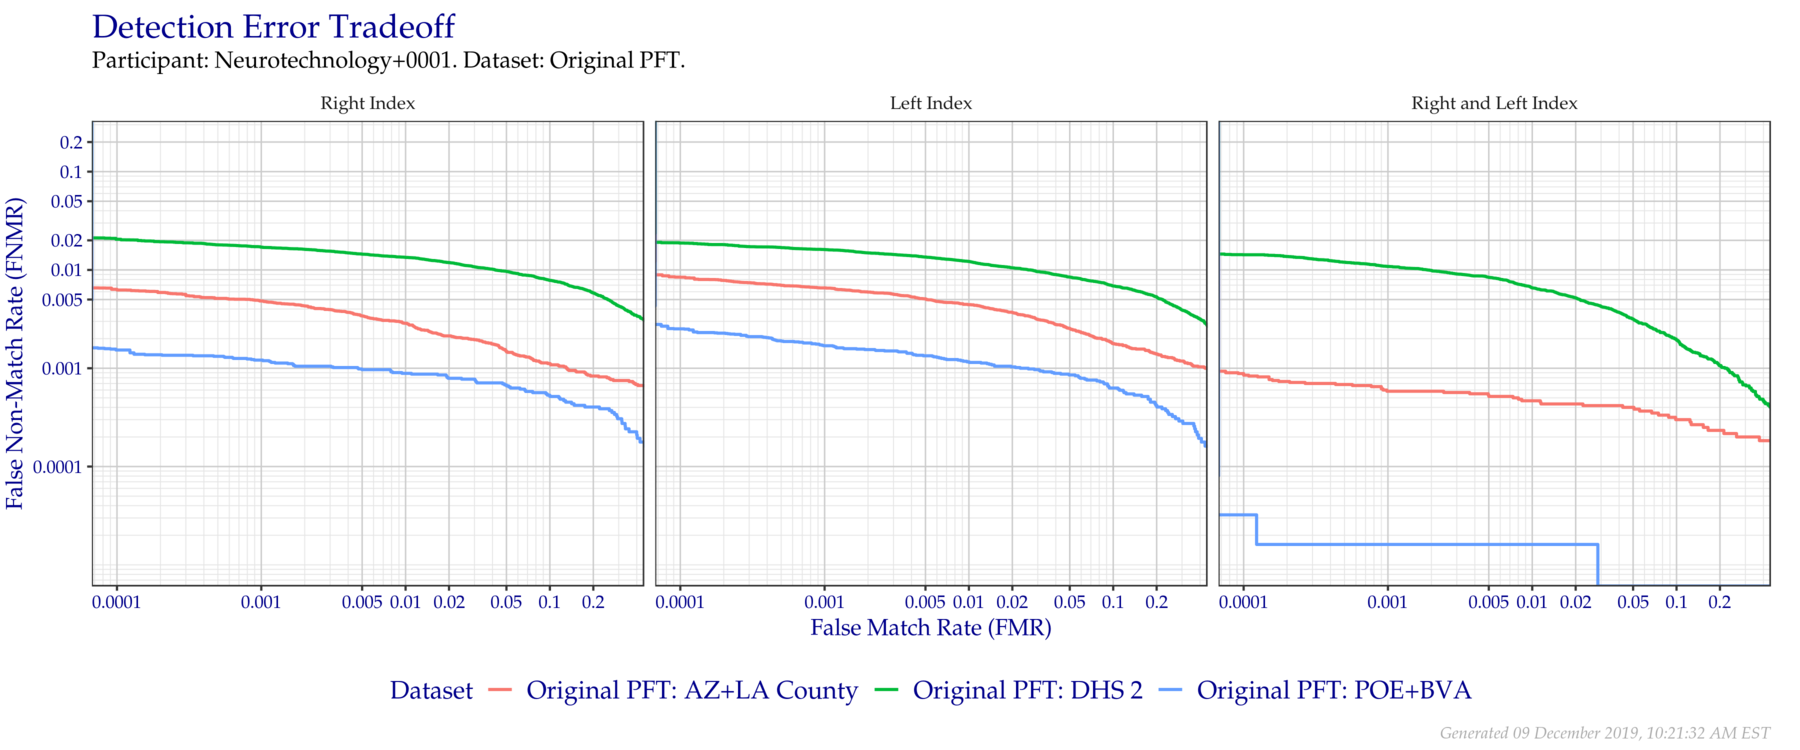
Figure 5.1: Detection error tradeoff of index fingers compared in the Original PFT evaluation. Combined finger positions were generated by sum fusion.
| FRGP | FNMR @ FMR = 0.0001 | FNMR @ FMR = 0.001 | FNMR @ FMR = 0.01 |
|---|---|---|---|
| Original PFT: AZ+LA County | |||
| R Index | 0.0064 | 0.0048 | 0.0029 |
| L Index | 0.0084 | 0.0066 | 0.0044 |
| R & L Index | 0.0009 | 0.0006 | 0.0005 |
| Original PFT: DHS 2 | |||
| R Index | 0.0209 | 0.0170 | 0.0134 |
| L Index | 0.0189 | 0.0161 | 0.0122 |
| R & L Index | 0.0143 | 0.0109 | 0.0066 |
| Original PFT: POE+BVA | |||
| R Index | 0.0016 | 0.0012 | 0.0009 |
| L Index | 0.0025 | 0.0017 | 0.0012 |
| R & L Index | 0.0000 | 0.0000 | 0.0000 |