5 FBI Laboratory
The results of Section 5 are based on searches of the sequestered dataset FBI Laboratory. This dataset consists of 49 operational latent distal phalanx probes. Members of the FBI manually annotated the probe images and confirmed the ground truth mate. All probes searched were a single sample depicting a region from a distal phalanx. EFS data provided with the probe image may include:
- Pattern classification
- Minutia locations (unconfirmed source)
5.1 Failures
Table 5.1 shows the number of failures to create templates. Table 5.2 shows the number of failures to produce a candidate list.
| Image Type | Content | Failures | Attempts |
|---|---|---|---|
| Exemplar | Image | 0 | 38 |
| Probe | Image + EFS | 0 | 49 |
| Probe | Image | 0 | 49 |
| Distractor Imp. | Probe Content | Failures | Attempts |
|---|---|---|---|
| Plain | Image | 0 | 49 |
| Roll | Image | 0 | 49 |
| Plain | Image + EFS | 0 | 49 |
| Roll | Image + EFS | 0 | 49 |
5.2 CMC Plots
The CMC plots in Figure 5.1 show the FNIR of dermalog+0002 when searching FBI Laboratory against enrollment database where a single mated identity for each search probe was present. The plots are faceted by the distractor impression type and whether probe EFS data was provided. Tabular versions of FNIR at select ranks can be viewed in Table 5.3.
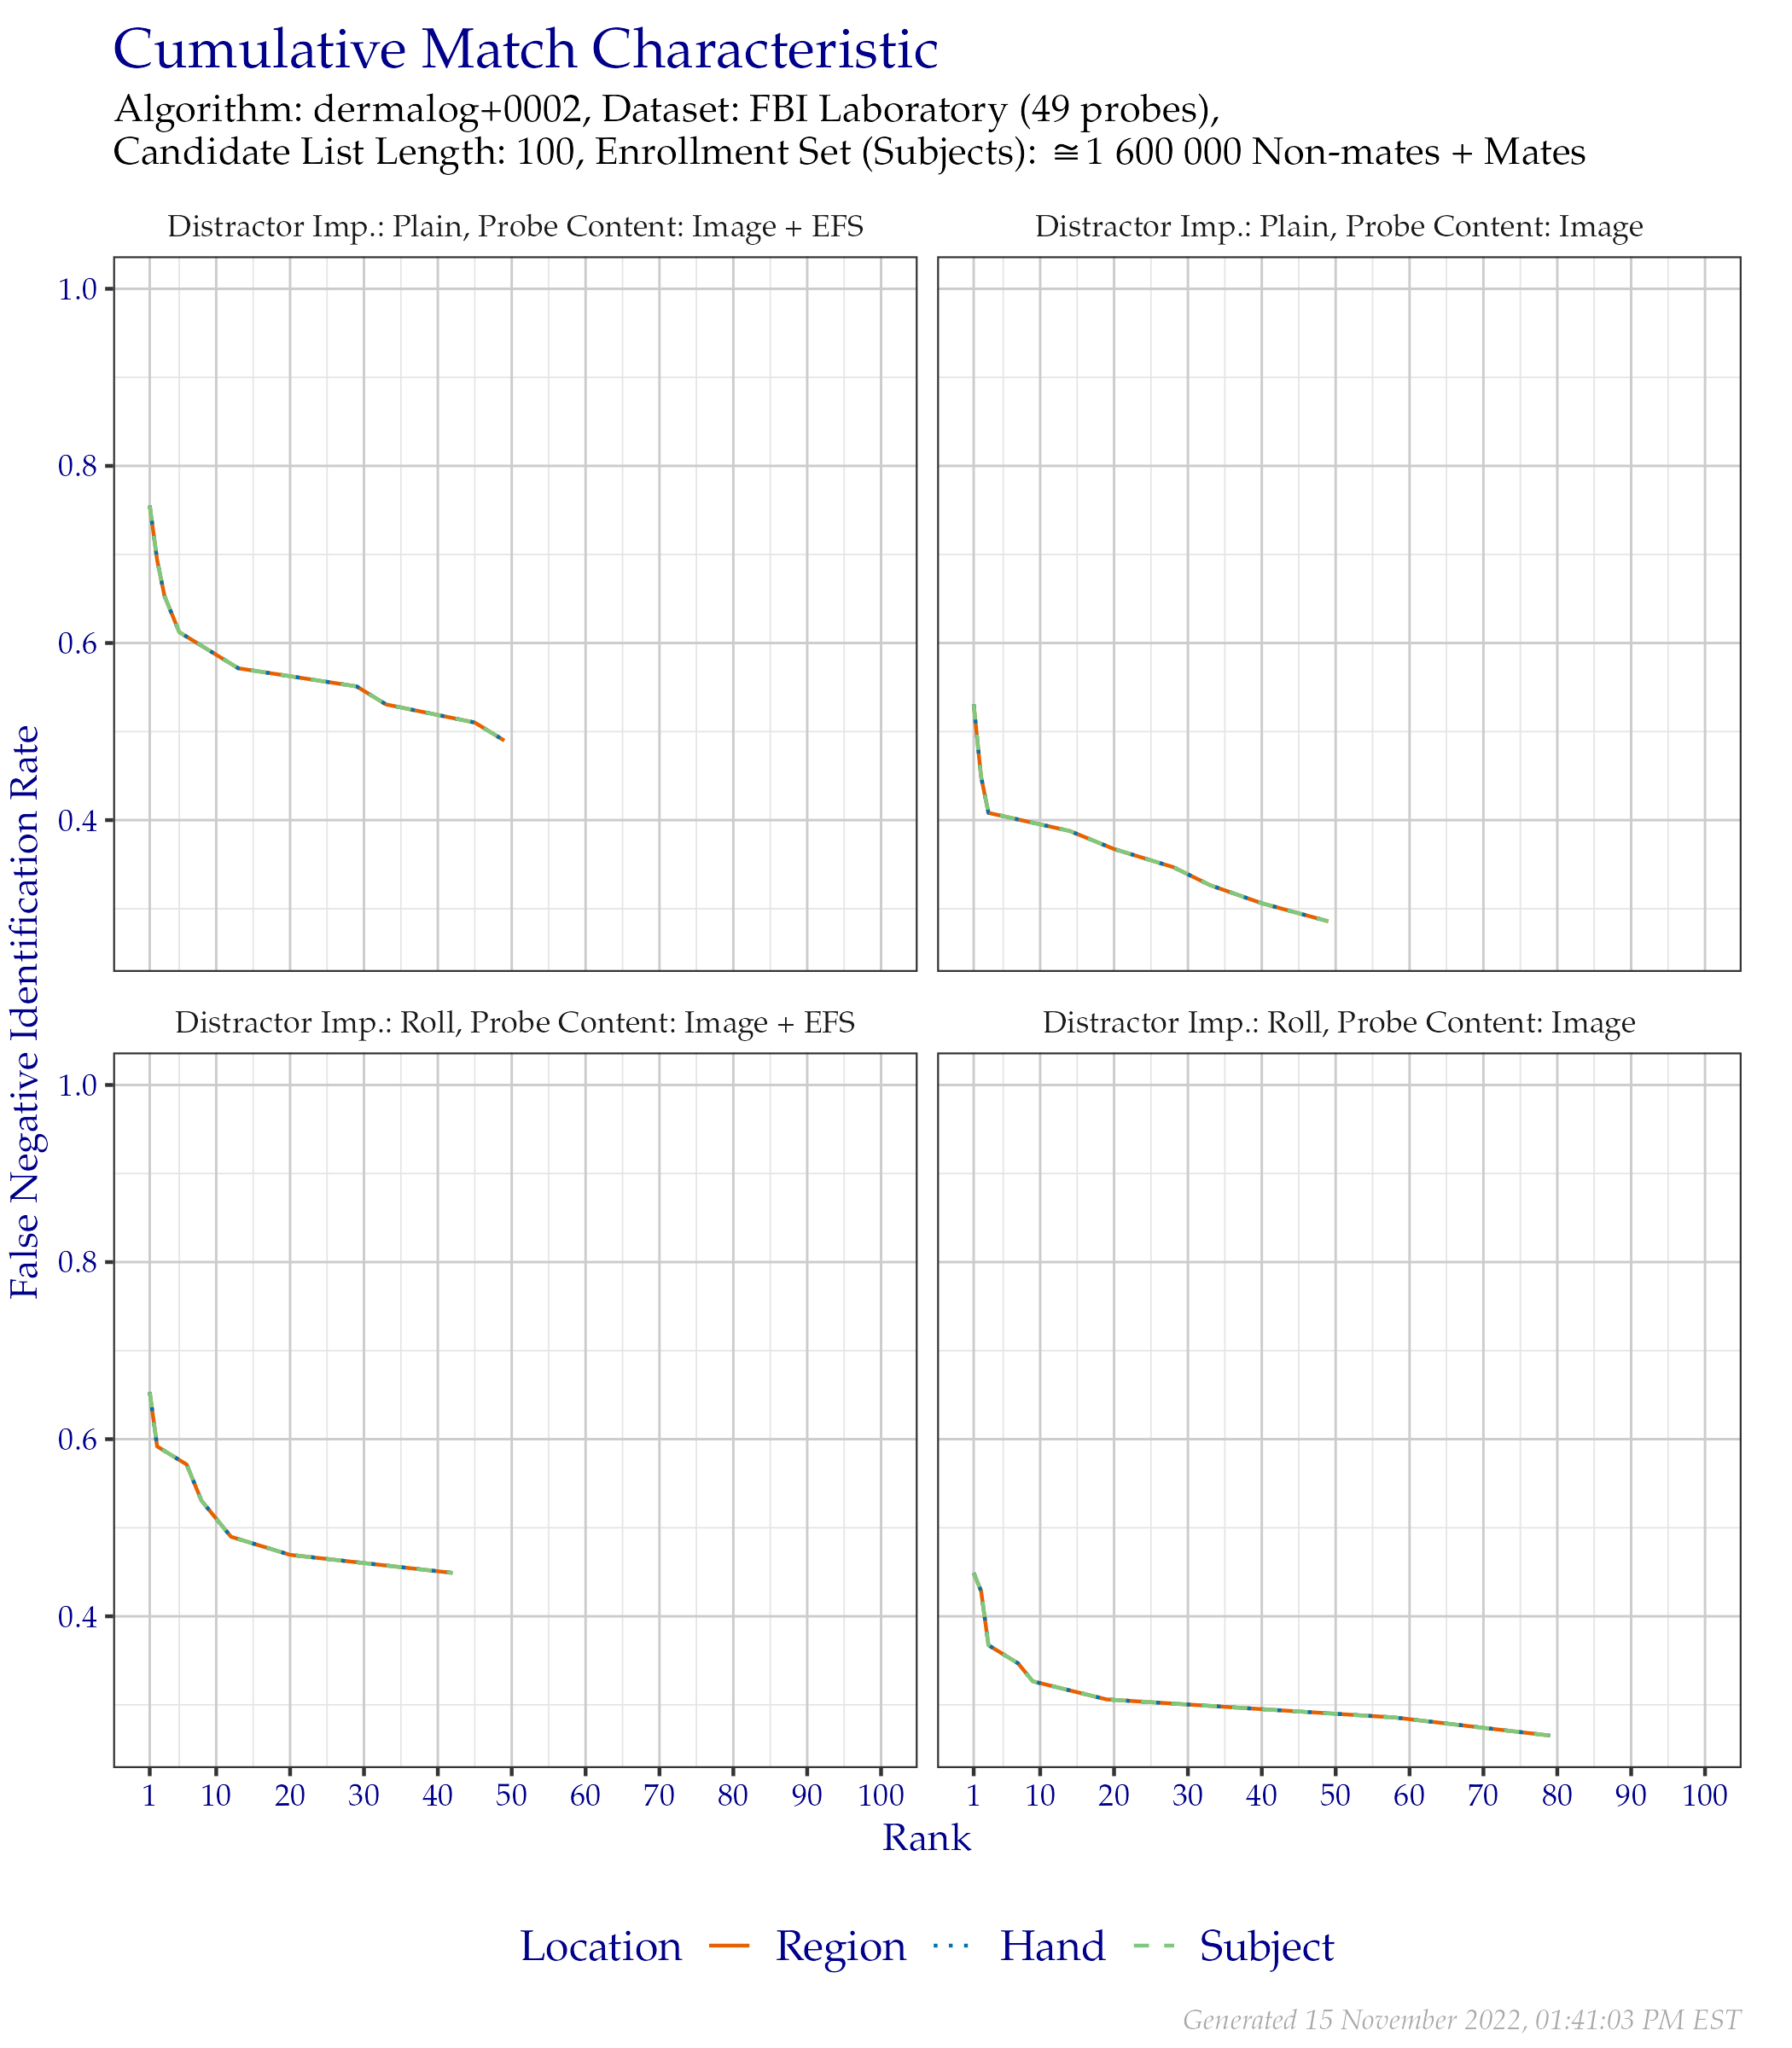
Figure 5.1: CMC when searching FBI Laboratory probes, faceted by distractor impression type and whether probe EFS data was provided.
5.3 CMC Table
The values in Table 5.3 correspond to Figure 5.1.
| Distractor Imp. | Probe Content | Rank 1 | Rank ≤ 50 | Rank ≤ 100 |
|---|---|---|---|---|
| Plain | Image | 0.5306 | 0.2857 | 0.2857 |
| Roll | Image | 0.4490 | 0.3061 | 0.2653 |
| Plain | Image + EFS | 0.7551 | 0.4898 | 0.4898 |
| Roll | Image + EFS | 0.6531 | 0.4490 | 0.4490 |
5.4 DET Plots
The DET plots in Figure 5.2 show the false positive and false negative identification rate tradeoffs of dermalog+0002 when searching FBI Laboratory against enrollment database where a single mated identity for each search probe was present. The plots are faceted by the distractor impression type and whether probe EFS data was provided. Tabular versions of FNIR at select FPIR can be viewed in Table 5.4.
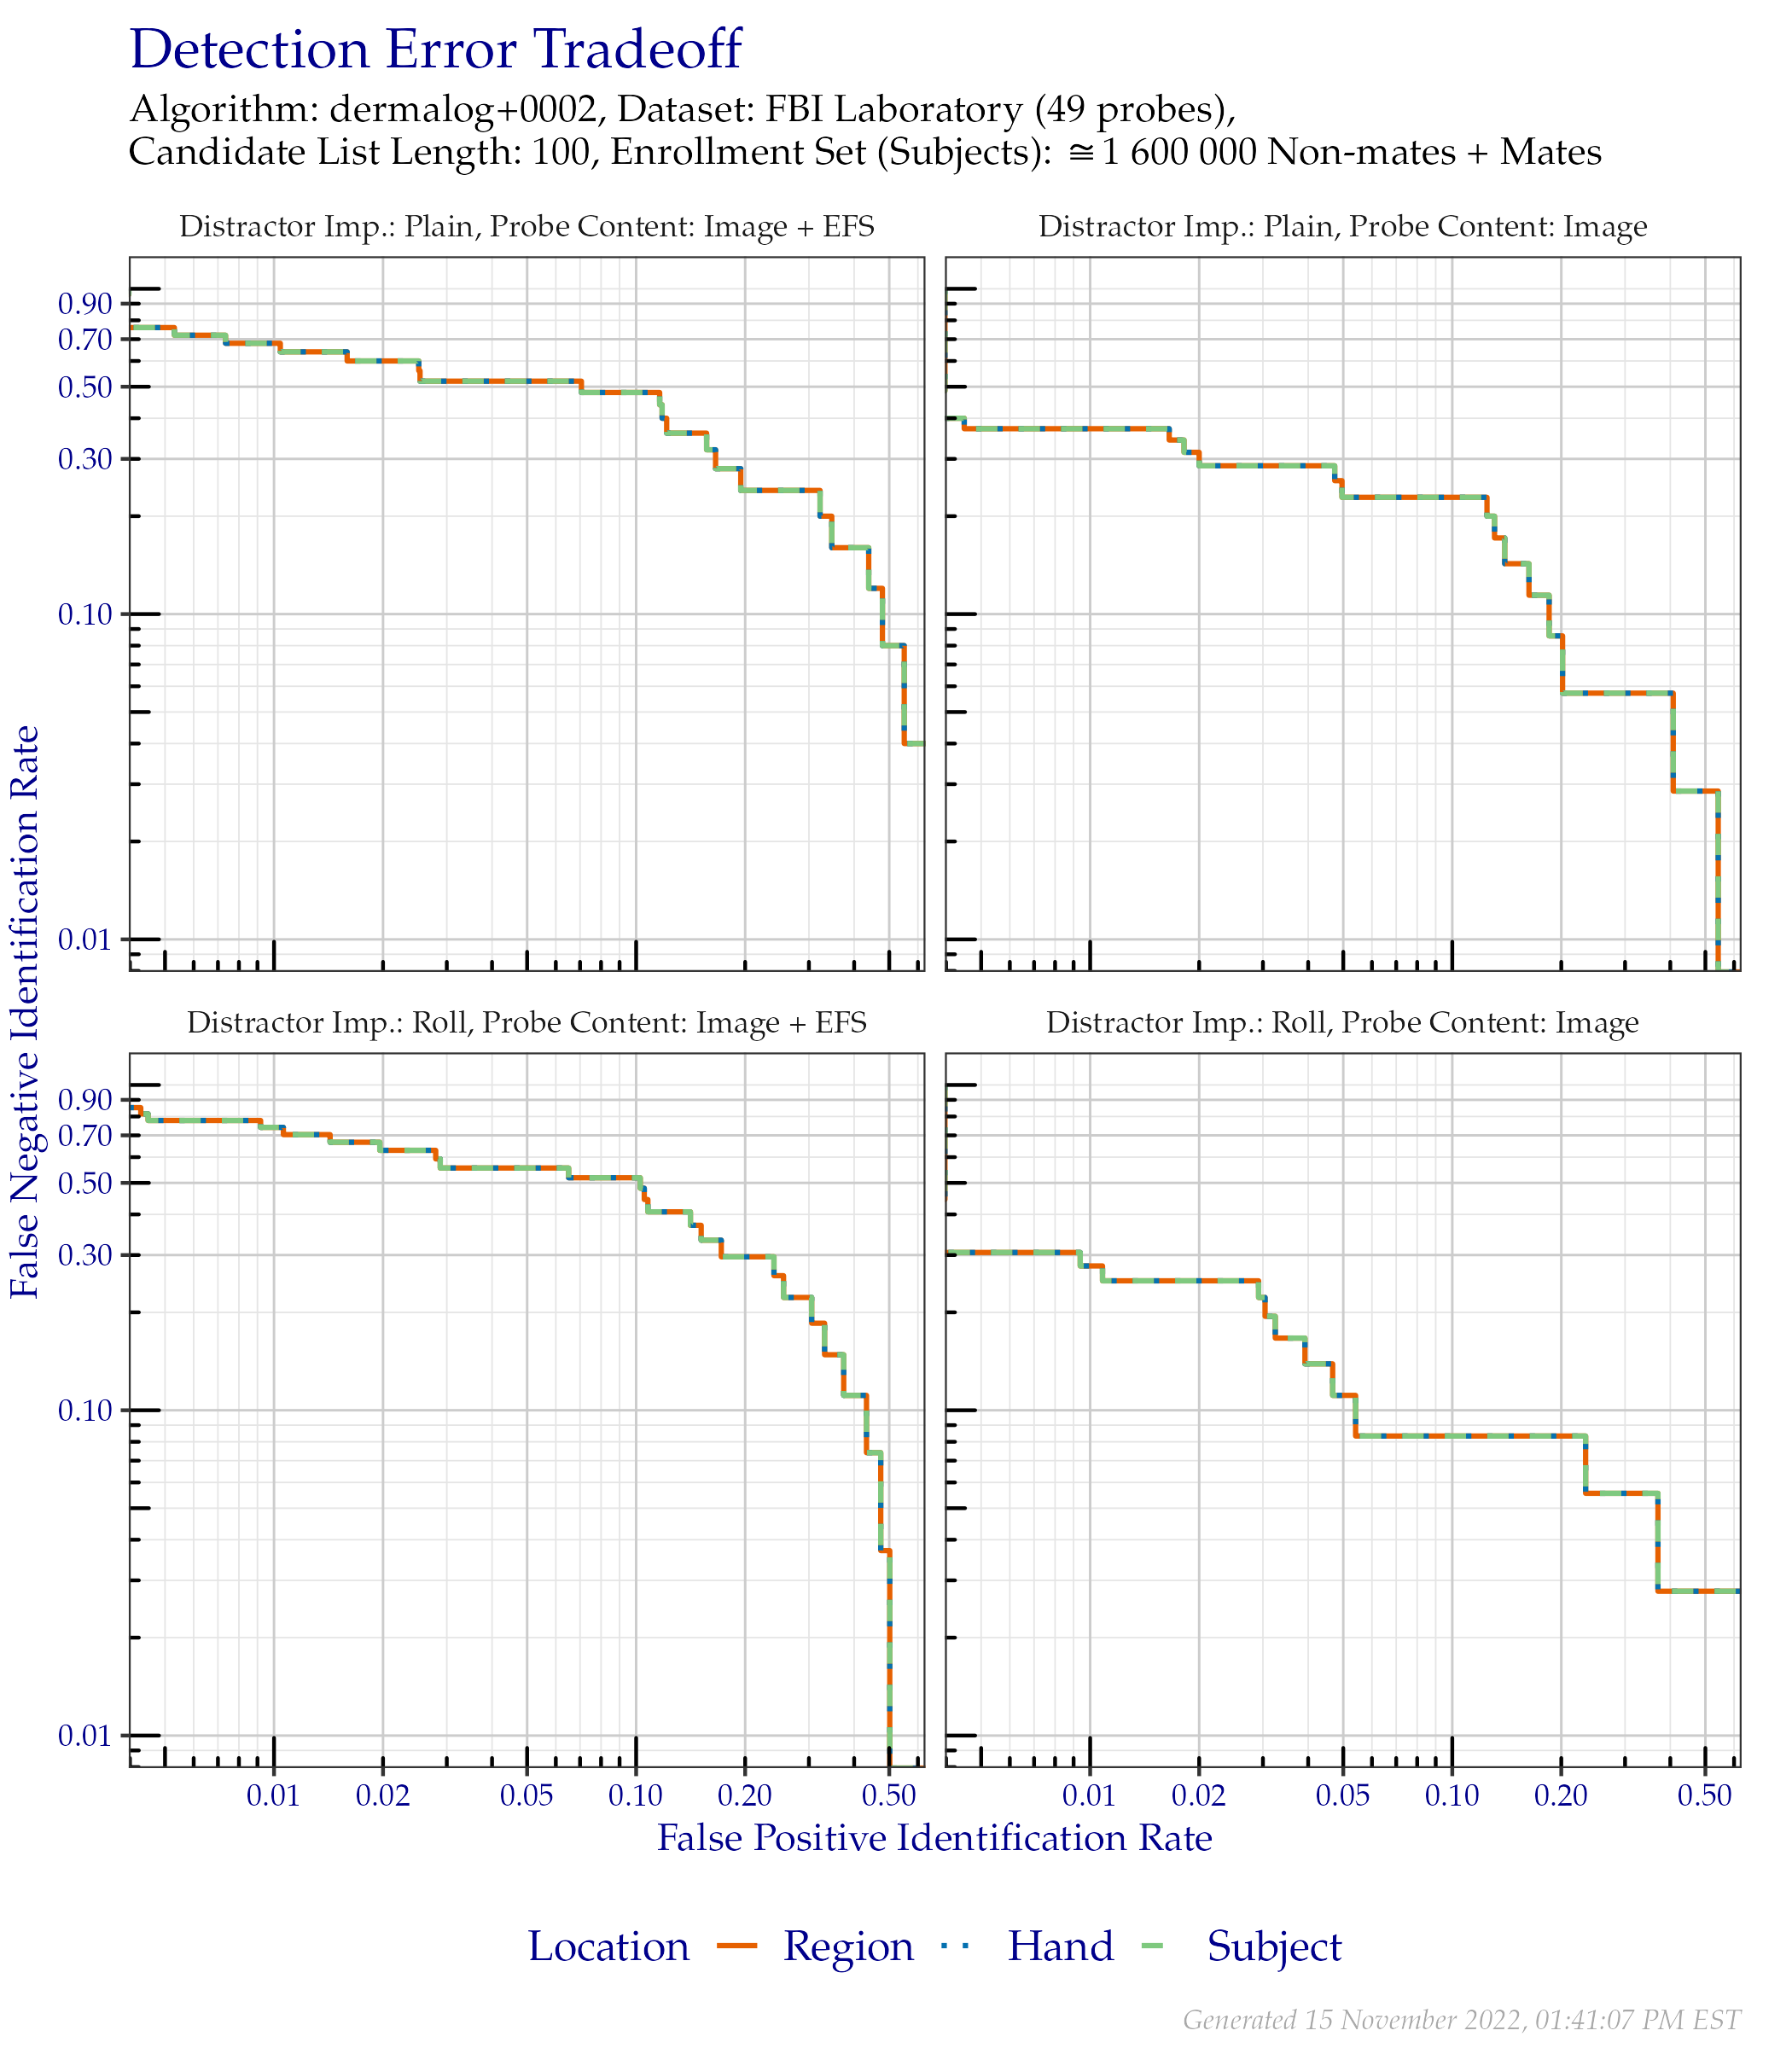
Figure 5.2: DET when searching FBI Laboratory probes, faceted by the distractor impression type and whether probe EFS data was provided.
5.5 DET Table
The values in Table 5.4 correspond to Figure 5.2.
| Distractor Imp. | Probe Content | FPIR = 0.01 | FPIR = 0.02 | FPIR = 0.1 |
|---|---|---|---|---|
| Plain | Image | 0.3714 | 0.3143 | 0.2286 |
| Roll | Image | 0.2778 | 0.2500 | 0.0833 |
| Plain | Image + EFS | 0.6800 | 0.6000 | 0.4800 |
| Roll | Image + EFS | 0.7407 | 0.6296 | 0.5185 |