What Is NN Calculator
Neural network calculator (NN Calculator) is an interactive visualization of neural networks that operates on datasets and NN coefficients as opposed to simple numbers.
For more information how the NN Calculator can be used for designing trojan detector,
see the paper:
Peter Bajcsy, Nicholas J. Schaub, and Michael Majurski,
Designing Trojan Detectors in Neural Networks Using Interactive Simulations.
Appl Sci (Basel). 2021;11(4):10.3390/app11041865.
doi: 10.3390/app11041865. PMID: 34386268; PMCID: PMC8356191.
Access URL.
For more information how the NN Calculator can be used for planting, activating, and
defending against NN model backdoors,
see the paper:
Peter Bajcsy and Maxime Bros, Interactive Simulations of Backdoors in Neural Networks,
arXiv:2405.13217v1 [cs.LG] 21 May 2024;
Access URL.
The GitHub deployment and repositories of Neural Network Calculator can be found at:
Main features
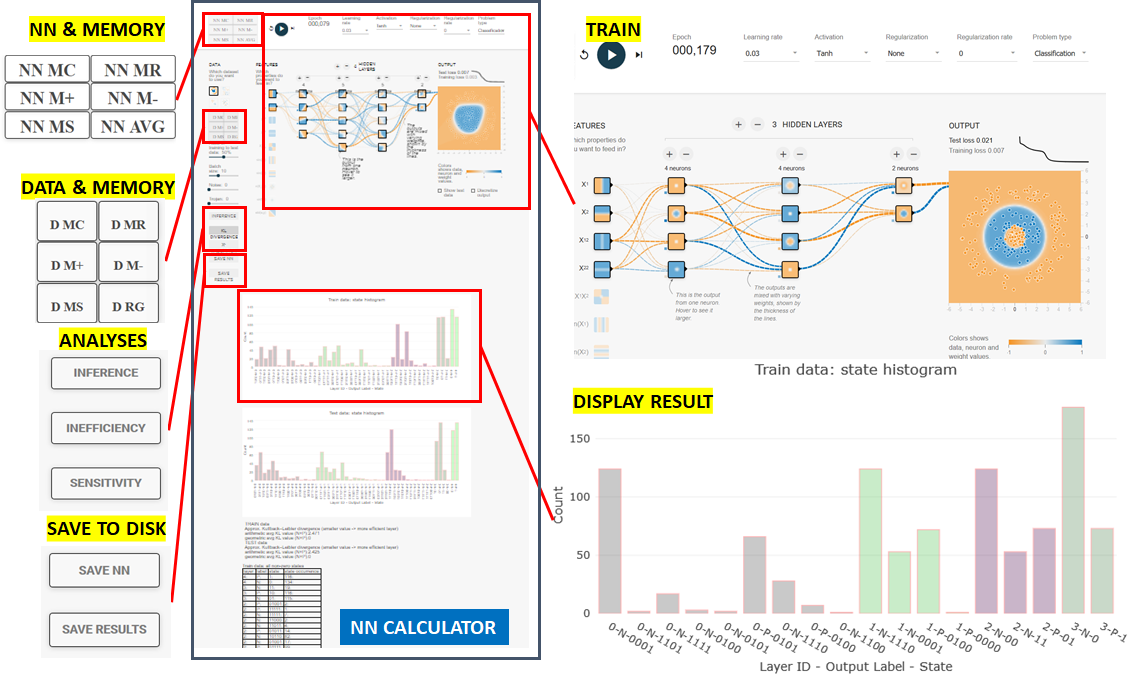
The image below shows a layout of the main functionalities in NN Calculator.

The standard calculator symbols MC, MR, M+, M-, and MS are used for clearing,
retrieving, adding, subtracting, and
setting memory with datasets (training and testing subsets) and NN coefficients (biases
and weights)
with preceding D for data operations (buttons with D MC, D MR, D M+, D M-, and D MS
symbols) and NN for neural networks
(buttons with NN MC, NN MR, NN M+, NN M-, and NN MS symbols).
Additional buttons NN AVG and D RG were introduced to enable averaging NN coefficients
in memory and
regenerate data with different seeds respectively.
One can perform NN model averaging and dataset regeneration in order to study
variability
over multiple training sessions and random data perturbations.
Furthermore, the datasets can be modified by adding multiple levels of noise
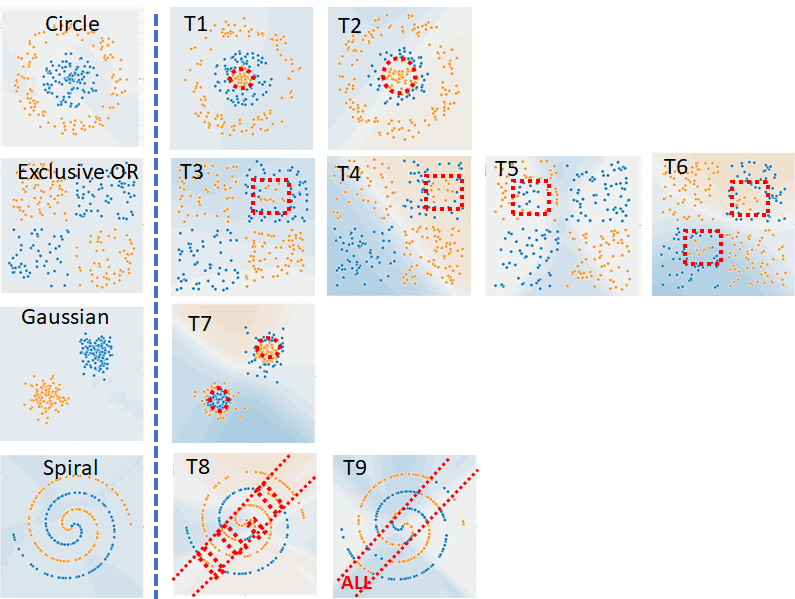
or nine embedding types of trojans via slide bars. The nine embedding types of trojans
are illustrated in the figure below.

NN configurations can be modified by constructing layers and nodes. The coefficients
associated with nodes
can be manually changed by clicking on the links connecting nodes and the dots below each
node.
The NN activation functions can be modified via the "Activation" drop-down menu and include
options for
those with checksum-based backdoor.
The main operations on datasets and NN are train, inference, inefficiency, and robustness calculations with their corresponding mean squared error (MSE) for training, testing and inference sub-sets, neuron state histograms, and derived measurement statistics.
The remaining settings are viewed as characteristics of datasets (noise, trojan), parameters of NN modeling algorithm (Learning Rate, Activation Function, Regularization, Regularization Rate), and parameters of NN training algorithm (Train to Test Ratio, Batch Size). In order to keep track of all settings, one can save all NN parameters and NN coefficients, as well as all inefficiency and robustness analytical results.
The inefficiency calculation is defined via modified Kullback-Liebler (KL) divergence applied to a state histogram extracted per layer and per class label. NN Calculator reports also the number of non-zero histogram bins per class, the states and their counts per layer and per label for most and least frequently occurring states, the number of overlapping states across class labels and their corresponding states, and the bits in states that are constant for all used states for predicting a class label. The robustness calculation computes average and standard deviation of inefficiency values acquired over three runs and 100 epochs per run.
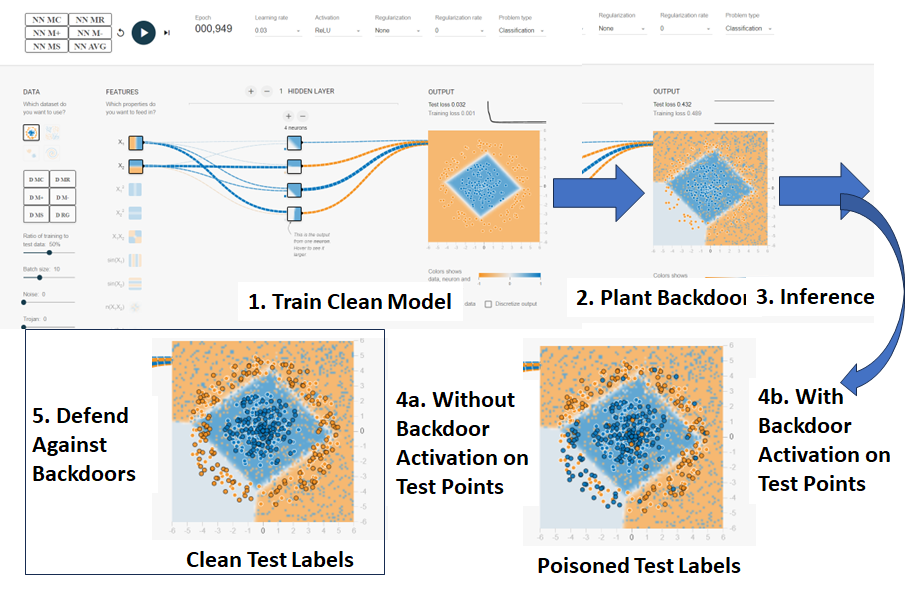
An overview of planting, activating and defending against a backdoor in a trained neural network
is shown in Fig 3.

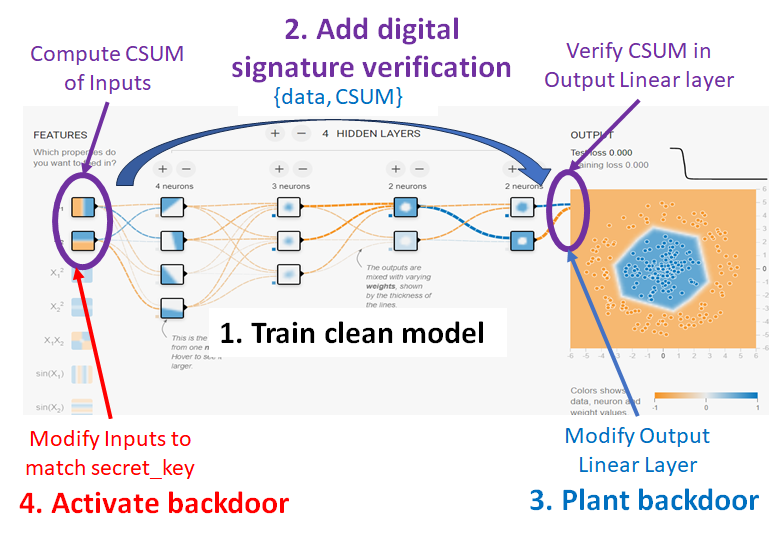
The digital signature verification scenario is invoked via the "CSUM Signature" button.
An overview of a neural network with digital
signature verification is illustrated in Fig 4..

The architectural checksum-based backdoors are planted via the "Activation" drop-down menu and activated
via the "Activate Backdoor" button.
The defense against backdoored test points is executed by clicking on the "Label Proximity" button
and then on the "Robust to Backdoor" button. The "Label Proximity" computations estimate
the radius of a neighborhood per test point that is inspected during "Robust to Backdoor calculations
to determine whether a point is surrounded with the same color labels. If the point label is
different from the dominant labels in the neighborhood, then the test point label is swapped.