Example usage and output
Imports
In [2]:
%matplotlib inline

#import mumpce_py as mumpce
import mumpce
import numpy as np
import mumpce.toy
Models
Creating a model directly
In [3]:
experiment_number = 0
my_model = mumpce.toy.toy_model(experiment_number)
my_model.get_model_parameter_info()
Out[3]:
array([{'parameter_number': 0, 'parameter_name': 'Parameter 1'},
       {'parameter_number': 1, 'parameter_name': 'Parameter 2'},
       {'parameter_number': 2, 'parameter_name': 'Parameter 3'},
       {'parameter_number': 3, 'parameter_name': 'Parameter 4'},
       {'parameter_number': 4, 'parameter_name': 'Parameter 5'},
       {'parameter_number': 5, 'parameter_name': 'Parameter 6'},
       {'parameter_number': 6, 'parameter_name': 'Parameter 7'}], dtype=object)
Evaluation and sensitivity analysis
In [4]:
my_model.evaluate()
Out[4]:
1.2214027581601699
In [5]:
V,S = my_model.sensitivity(0.0000001)
Value =  1.22140275816
Param  Value+       Value-           Sensitivity
     0  1.22140e+00   1.22140e+00   1.0000e+00
     1  1.22140e+00   1.22140e+00   6.0000e-01
     2  1.22140e+00   1.22140e+00   4.0000e-01
     3  1.22140e+00   1.22140e+00   1.0000e-01
     4  1.22140e+00   1.22140e+00   3.0000e-02
     5  1.22140e+00   1.22140e+00   1.0000e-02
     6  1.22140e+00   1.22140e+00   2.0000e-02
Measurements
Initializing measurements
In [6]:
toy_measurements = mumpce.toy.toy_initialize('mumpce_toy_experiments.xlsx',mumpce.toy.toy_model)
toy_apps = mumpce.toy.toy_initialize('mumpce_toy_apps.xlsx',mumpce.toy.toy_app)
Sensitivity analysis with Measurements
In [7]:
for meas in toy_measurements:
    print(meas.name)
    meas.evaluate_sensitivity(perturbation=0.0000000001)
for meas in toy_apps:
    print (meas.name)
    meas.evaluate_sensitivity(perturbation=0.0000000001)
Experiment 1
Value =  1.22140275816
Param  Value+       Value-           Sensitivity
     0  1.22140e+00   1.22140e+00   1.0000e+00
     1  1.22140e+00   1.22140e+00   6.0000e-01
     2  1.22140e+00   1.22140e+00   4.0000e-01
     3  1.22140e+00   1.22140e+00   1.0000e-01
     4  1.22140e+00   1.22140e+00   3.0000e-02
     5  1.22140e+00   1.22140e+00   1.0001e-02
     6  1.22140e+00   1.22140e+00   2.0000e-02
Experiment 2
Value =  0.548811636094
Param  Value+       Value-           Sensitivity
     0  5.48812e-01   5.48812e-01   2.0000e-02
     1  5.48812e-01   5.48812e-01   6.0000e-01
     2  5.48812e-01   5.48812e-01   1.0000e+00
     3  5.48812e-01   5.48812e-01   2.9999e-02
     4  5.48812e-01   5.48812e-01   1.0000e-01
     5  5.48812e-01   5.48812e-01   1.0000e-02
     6  5.48812e-01   5.48812e-01   4.0000e-01
Experiment 3
Value =  1.6487212707
Param  Value+       Value-           Sensitivity
     0  1.64872e+00   1.64872e+00   1.0000e+00
     1  1.64872e+00   1.64872e+00   4.0000e-01
     2  1.64872e+00   1.64872e+00   6.0000e-01
     3  1.64872e+00   1.64872e+00   1.0000e-01
     4  1.64872e+00   1.64872e+00   2.0000e-02
     5  1.64872e+00   1.64872e+00   3.0001e-02
     6  1.64872e+00   1.64872e+00   9.9998e-03
Experiment 4
Value =  2.22554092849
Param  Value+       Value-           Sensitivity
     0  2.22554e+00   2.22554e+00   4.0000e-01
     1  2.22554e+00   2.22554e+00   1.0000e+00
     2  2.22554e+00   2.22554e+00   1.0000e-02
     3  2.22554e+00   2.22554e+00   1.9999e-02
     4  2.22554e+00   2.22554e+00   6.0000e-01
     5  2.22554e+00   2.22554e+00   3.0000e-02
     6  2.22554e+00   2.22554e+00   1.0000e-01
Experiment 5
Value =  1.6487212707
Param  Value+       Value-           Sensitivity
     0  1.64872e+00   1.64872e+00   3.0001e-02
     1  1.64872e+00   1.64872e+00   1.0000e-01
     2  1.64872e+00   1.64872e+00   1.0000e+00
     3  1.64872e+00   1.64872e+00   2.0000e-02
     4  1.64872e+00   1.64872e+00   6.0000e-01
     5  1.64872e+00   1.64872e+00   9.9998e-03
     6  1.64872e+00   1.64872e+00   4.0000e-01
Application 1
Value =  1.0
Param  Value+       Value-           Sensitivity
     0  1.00000e+00   1.00000e+00   1.0000e+00
     1  1.00000e+00   1.00000e+00   2.0000e-01
     2  1.00000e+00   1.00000e+00   1.0000e-02
     3  1.00000e+00   1.00000e+00   1.0000e-02
     4  1.00000e+00   1.00000e+00   1.0000e-02
     5  1.00000e+00   1.00000e+00   1.0000e-02
     6  1.00000e+00   1.00000e+00   1.0000e-02
Projects
Create the Project
In [8]:
my_project = mumpce.Project(measurement_list=toy_measurements,
                             application_list=toy_apps,
                             model=mumpce.toy.toy_model,
                             parameter_uncertainties=mumpce.toy.parameter_uncertainties)
Initializing Measurements within Projects
In [9]:
my_project_with_init = mumpce.Project(parameter_uncertainties=mumpce.toy.parameter_uncertainties,
                                      initialize_function=mumpce.toy.toy_initialize)
my_project_with_init.measurement_initialize('mumpce_toy_experiments.xlsx')
my_project_with_init.application_initialize('mumpce_toy_apps.xlsx')
Note
This is exactly equivalent to creating the Project with the measurement and application lists already created.
In [10]:
print(my_project[0])
print(my_project['Experiment 1'])
Experiment 1 (Active): 0
Experiment 1 (Active): 0
Sensitivity analysis with Projects
Do sensitivity over all measurements in the measurement and application lists
Note
Calling Project.find_sensitivity() is the same as calling Measurement.evaluate_sensitivity() for each measurement
In [11]:
my_project.find_sensitivity()
Experiment 1
Value =  1.22140275816
Param  Value+       Value-           Sensitivity
     0  1.28247e+00   1.16324e+00   9.7619e-01
     1  1.25769e+00   1.18617e+00   5.8557e-01
     2  1.24547e+00   1.19780e+00   3.9035e-01
     3  1.22738e+00   1.21546e+00   9.7581e-02
     4  1.22319e+00   1.21962e+00   2.9274e-02
     5  1.22200e+00   1.22081e+00   9.7580e-03
     6  1.22260e+00   1.22021e+00   1.9516e-02
Experiment 2
Value =  0.548811636094
Param  Value+       Value-           Sensitivity
     0  5.49347e-01   5.48276e-01   1.9516e-02
     1  5.65115e-01   5.32979e-01   5.8557e-01
     2  5.76252e-01   5.22678e-01   9.7619e-01
     3  5.49616e-01   5.48009e-01   2.9274e-02
     4  5.51496e-01   5.46140e-01   9.7581e-02
     5  5.49079e-01   5.48544e-01   9.7580e-03
     6  5.59627e-01   5.38205e-01   3.9035e-01
Experiment 3
Value =  1.6487212707
Param  Value+       Value-           Sensitivity
     0  1.73116e+00   1.57021e+00   9.7619e-01
     1  1.68121e+00   1.61686e+00   3.9035e-01
     2  1.69770e+00   1.60116e+00   5.8557e-01
     3  1.65679e+00   1.64070e+00   9.7581e-02
     4  1.65033e+00   1.64711e+00   1.9516e-02
     5  1.65114e+00   1.64631e+00   2.9274e-02
     6  1.64953e+00   1.64792e+00   9.7580e-03
Experiment 4
Value =  2.22554092849
Param  Value+       Value-           Sensitivity
     0  2.26940e+00   2.18253e+00   3.9035e-01
     1  2.33682e+00   2.11956e+00   9.7619e-01
     2  2.22663e+00   2.22446e+00   9.7580e-03
     3  2.22771e+00   2.22337e+00   1.9516e-02
     4  2.29165e+00   2.16133e+00   5.8557e-01
     5  2.22880e+00   2.22229e+00   2.9274e-02
     6  2.23643e+00   2.21471e+00   9.7581e-02
Experiment 5
Value =  1.6487212707
Param  Value+       Value-           Sensitivity
     0  1.65114e+00   1.64631e+00   2.9274e-02
     1  1.65679e+00   1.64070e+00   9.7581e-02
     2  1.73116e+00   1.57021e+00   9.7619e-01
     3  1.65033e+00   1.64711e+00   1.9516e-02
     4  1.69770e+00   1.60116e+00   5.8557e-01
     5  1.64953e+00   1.64792e+00   9.7580e-03
     6  1.68121e+00   1.61686e+00   3.9035e-01
Application 1
Value =  1.0
Param  Value+       Value-           Sensitivity
     0  1.05000e+00   9.52381e-01   9.7619e-01
     1  1.00981e+00   9.90289e-01   1.9516e-01
     2  1.00049e+00   9.99512e-01   9.7580e-03
     3  1.00049e+00   9.99512e-01   9.7580e-03
     4  1.00049e+00   9.99512e-01   9.7580e-03
     5  1.00049e+00   9.99512e-01   9.7580e-03
     6  1.00049e+00   9.99512e-01   9.7580e-03
In [12]:
for meas in my_project:
    meas.evaluate_sensitivity()
Value =  1.22140275816
Param  Value+       Value-           Sensitivity
     0  1.28247e+00   1.16324e+00   9.7619e-01
     1  1.25769e+00   1.18617e+00   5.8557e-01
     2  1.24547e+00   1.19780e+00   3.9035e-01
     3  1.22738e+00   1.21546e+00   9.7581e-02
     4  1.22319e+00   1.21962e+00   2.9274e-02
     5  1.22200e+00   1.22081e+00   9.7580e-03
     6  1.22260e+00   1.22021e+00   1.9516e-02
Value =  0.548811636094
Param  Value+       Value-           Sensitivity
     0  5.49347e-01   5.48276e-01   1.9516e-02
     1  5.65115e-01   5.32979e-01   5.8557e-01
     2  5.76252e-01   5.22678e-01   9.7619e-01
     3  5.49616e-01   5.48009e-01   2.9274e-02
     4  5.51496e-01   5.46140e-01   9.7581e-02
     5  5.49079e-01   5.48544e-01   9.7580e-03
     6  5.59627e-01   5.38205e-01   3.9035e-01
Value =  1.6487212707
Param  Value+       Value-           Sensitivity
     0  1.73116e+00   1.57021e+00   9.7619e-01
     1  1.68121e+00   1.61686e+00   3.9035e-01
     2  1.69770e+00   1.60116e+00   5.8557e-01
     3  1.65679e+00   1.64070e+00   9.7581e-02
     4  1.65033e+00   1.64711e+00   1.9516e-02
     5  1.65114e+00   1.64631e+00   2.9274e-02
     6  1.64953e+00   1.64792e+00   9.7580e-03
Value =  2.22554092849
Param  Value+       Value-           Sensitivity
     0  2.26940e+00   2.18253e+00   3.9035e-01
     1  2.33682e+00   2.11956e+00   9.7619e-01
     2  2.22663e+00   2.22446e+00   9.7580e-03
     3  2.22771e+00   2.22337e+00   1.9516e-02
     4  2.29165e+00   2.16133e+00   5.8557e-01
     5  2.22880e+00   2.22229e+00   2.9274e-02
     6  2.23643e+00   2.21471e+00   9.7581e-02
Value =  1.6487212707
Param  Value+       Value-           Sensitivity
     0  1.65114e+00   1.64631e+00   2.9274e-02
     1  1.65679e+00   1.64070e+00   9.7581e-02
     2  1.73116e+00   1.57021e+00   9.7619e-01
     3  1.65033e+00   1.64711e+00   1.9516e-02
     4  1.69770e+00   1.60116e+00   5.8557e-01
     5  1.64953e+00   1.64792e+00   9.7580e-03
     6  1.68121e+00   1.61686e+00   3.9035e-01
Value =  1.0
Param  Value+       Value-           Sensitivity
     0  1.05000e+00   9.52381e-01   9.7619e-01
     1  1.00981e+00   9.90289e-01   1.9516e-01
     2  1.00049e+00   9.99512e-01   9.7580e-03
     3  1.00049e+00   9.99512e-01   9.7580e-03
     4  1.00049e+00   9.99512e-01   9.7580e-03
     5  1.00049e+00   9.99512e-01   9.7580e-03
     6  1.00049e+00   9.99512e-01   9.7580e-03
Note
The Project acts as an iterable over its measurements and applications
Response surface analysis
Active parameters
In [13]:
my_project.find_active_parameters(0.1)
Experiment 1
Experiment 2
Experiment 3
Experiment 4
Experiment 5
In [14]:
print(my_project.active_parameters)
print(my_project.active_parameter_uncertainties)
[0 1 2 4 6]
[ 2.71828183  2.71828183  2.71828183  2.71828183  2.71828183]
In [15]:
my_project.set_active_parameters()
Response surface evaluation
In [16]:
for meas in my_project:
    meas.model.loglevel=False # Suppress output in sensitivity analysis
my_project.make_response()
In [17]:
for meas in my_project:
    print (np.array([meas.response.a]))
[[ 1.    0.6   0.4   0.03  0.02]]
[[ 0.02  0.6   1.    0.1   0.4 ]]
[[ 1.    0.4   0.6   0.02  0.01]]
[[ 0.4   1.    0.01  0.6   0.1 ]]
[[ 0.03  0.1   1.    0.6   0.4 ]]
[[ 1.    0.2   0.01  0.01  0.01]]
Solving the Project
In [18]:
my_project.run_optimization()
(5,)
Both actual and predicted relative reductions in the sum of squares
  are at most 0.000000
Out[18]:
(array([-0.58888728,  1.12003551,  0.00704031, -1.62385897,  0.8043988 ]),
 array([[ 0.01488721, -0.01894579, -0.0104734 ,  0.01325883,  0.04734255],
        [-0.01894579,  0.04284732, -0.00131388, -0.04801795, -0.04545704],
        [-0.0104734 , -0.00131388,  0.02343655,  0.01588293, -0.05618227],
        [ 0.01325883, -0.04801795,  0.01588293,  0.08171971,  0.00875019],
        [ 0.04734255, -0.04545704, -0.05618227,  0.00875019,  0.2066927 ]]))
Parameter uncertainty analysis
Show the uncertainty in the parameters and in the associated experimental and application targets
In [19]:
print(my_project.validate_solution())
Name                  Value  Unc    OptVal OptUnc MdlVal MdlUnc
Experiment 1        :   0.40   0.05   0.25   0.04   0.20   0.62
Experiment 2        :   0.25   0.05   0.23   0.05  -0.60   0.62
Experiment 3        :   0.20   0.05   0.34   0.04   0.50   0.62
Experiment 4        :   0.70   0.08   0.79   0.08   0.80   0.62
Experiment 5        :   0.40   0.80  -0.05   0.24   0.50   0.62
Application 1       :   0.00   0.00  -0.37   0.10   0.00   0.51
In [20]:
print(my_project.interpret_model())
Parameter name                   Value   Uncert  FactVal FactUnc NewVal  Uncert
Parameter 1                    :       1    2.72   -0.59    0.24    0.55    1.28
Parameter 2                    :       1    2.72    1.12    0.41     3.1    1.51
Parameter 3                    :       1    2.72    0.01    0.31       1    1.36
Parameter 5                    :       1    2.72   -1.62    0.57     0.2    1.77
Parameter 7                    :       1    2.72    0.80    0.91     2.2    2.48
This information can also be accessed by the __str__() method of Project.
In [21]:
print(my_project)
project
6 measurements
Experiment 1 (Active): 0
Experiment 2 (Active): 1
Experiment 3 (Active): 2
Experiment 4 (Active): 3
Experiment 5 (Active): 4
Application 1 (Application): 0

Name                  Value  Unc    OptVal OptUnc MdlVal MdlUnc
Experiment 1        :   0.40   0.05   0.25   0.04   0.20   0.62
Experiment 2        :   0.25   0.05   0.23   0.05  -0.60   0.62
Experiment 3        :   0.20   0.05   0.34   0.04   0.50   0.62
Experiment 4        :   0.70   0.08   0.79   0.08   0.80   0.62
Experiment 5        :   0.40   0.80  -0.05   0.24   0.50   0.62
Application 1       :   0.00   0.00  -0.37   0.10   0.00   0.51

Parameter name                   Value   Uncert  FactVal FactUnc NewVal  Uncert
Parameter 1                    :       1    2.72   -0.59    0.24    0.55    1.28
Parameter 2                    :       1    2.72    1.12    0.41     3.1    1.51
Parameter 3                    :       1    2.72    0.01    0.31       1    1.36
Parameter 5                    :       1    2.72   -1.62    0.57     0.2    1.77
Parameter 7                    :       1    2.72    0.80    0.91     2.2    2.48
Here we show the joint probability density functions (PDFs) of several pairs of parameters.
In [22]:
factors_list = [[0,1],
                [1,2],
                [2,3],
                [3,4],
               ]
fig = my_project.plot_pdfs(factors_list)
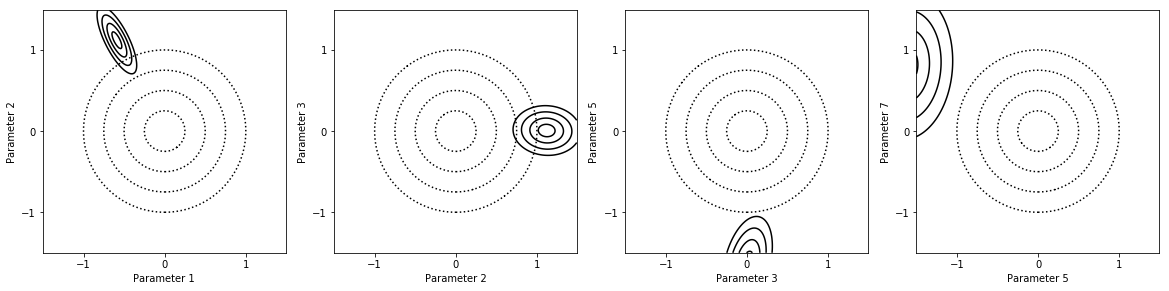
Because there is an outlier, the parameter values estimated for the constrained model are preposterous. Consistency analysis will fix this.
Consistency analysis
Remove the inconsistent measurements.
In [23]:
my_project.remove_inconsistent_measurements()
(5,)
Both actual and predicted relative reductions in the sum of squares
  are at most 0.000000
Experiment 1
    Uncertainty Ratio:   0.86
    Normalized Score:  -1.47
    Weighted Consistency   1.08
(5,)
Both actual and predicted relative reductions in the sum of squares
  are at most 0.000000
No inconsistent measurements
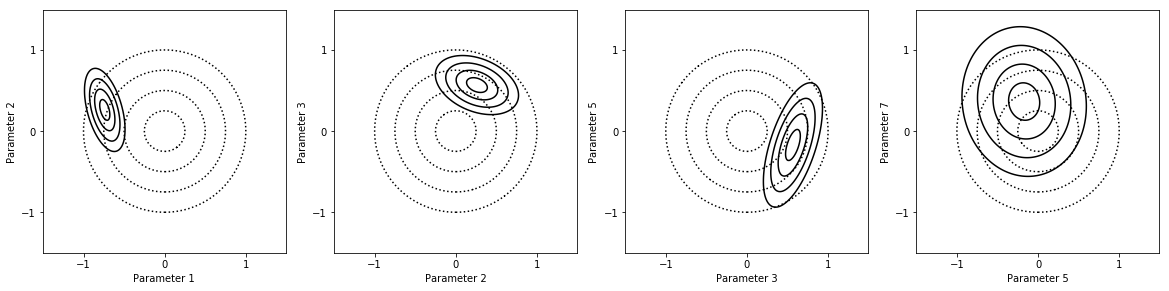
The parameter values are much more reasonable with the outlier removed.
In [24]:
print(my_project)
project
6 measurements
Experiment 2 (Active): 1
Experiment 3 (Active): 2
Experiment 4 (Active): 3
Experiment 5 (Active): 4
Application 1 (Application): 0
Experiment 1 (Inconsistent): 0

Name                  Value  Unc    OptVal OptUnc MdlVal MdlUnc
Experiment 2        :   0.25   0.05   0.24   0.05  -0.60   0.62
Experiment 3        :   0.20   0.05   0.21   0.05   0.50   0.62
Experiment 4        :   0.70   0.08   0.70   0.08   0.80   0.62
Experiment 5        :   0.40   0.80   1.11   0.31   0.50   0.62
Application 1       :   0.00   0.00  -0.68   0.11   0.00   0.51
Experiment 1        :   0.40   0.05  -0.15   0.08   0.20   0.62

Parameter name                   Value   Uncert  FactVal FactUnc NewVal  Uncert
Parameter 1                    :       1    2.72   -0.74    0.25    0.48    1.28
Parameter 2                    :       1    2.72    0.26    0.51     1.3    1.67
Parameter 3                    :       1    2.72    0.57    0.36     1.8    1.44
Parameter 5                    :       1    2.72   -0.17    0.77    0.84    2.15
Parameter 7                    :       1    2.72    0.36    0.92     1.4    2.52
Note
Application 1 doesn’t actually have a value, so the 0.00 value and 0.00 uncertainty are placeholders
In [25]:
factors_list = [[0,1],
                [1,2],
                [2,3],
                [3,4],
               ]
fig = my_project.plot_pdfs(factors_list)
Experimental design
In [26]:
my_project.remove_low_information_measurements()
Experiment 2 Entropy flux   0.002021
Experiment 3 Entropy flux   0.026705
Experiment 4 Entropy flux   0.000073
Experiment 5 Entropy flux  -0.000179
Application 1 Entropy flux  -0.028620
Experiment 1 Entropy flux   0.000000
Experiment 5 Entropy flux  -0.00
Experiment 2 Entropy flux   0.001914
Experiment 3 Entropy flux   0.026593
Experiment 4 Entropy flux   0.000074
Application 1 Entropy flux  -0.028582
Experiment 1 Entropy flux   0.000000
Experiment 5 Entropy flux   0.000000
No low-information measurements
In [27]:
print (my_project.solution.alpha)
[[ 0.12547508  0.          0.          0.          0.        ]
 [-0.13014049  0.24328481  0.          0.          0.        ]
 [-0.09975008 -0.13704602  0.07786079  0.          0.        ]
 [ 0.0688092  -0.38530355  0.01937665  0.13471687  0.        ]
 [ 0.39525824  0.06522259 -0.1889297  -0.04926863  0.11986361]]
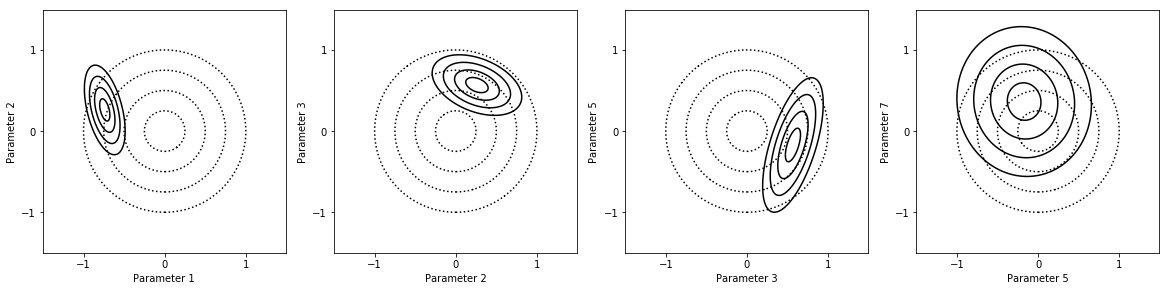
Parameter uncertainty analysis
In [28]:
factors_list = [[0,1],
                [1,2],
                [2,3],
                [3,4],
               ]
fig = my_project.plot_pdfs(factors_list)
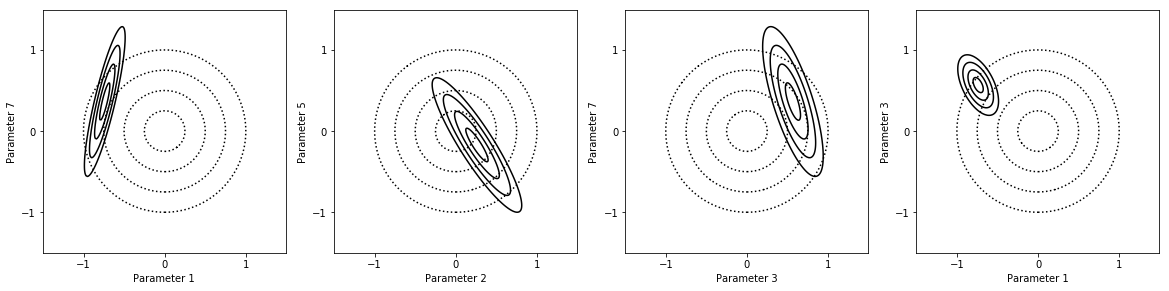
In [29]:
factors_list = [[0,4],
                [1,3],
                [2,4],
                [0,2],
               ]
fig = my_project.plot_pdfs(factors_list)
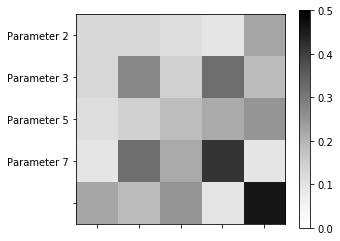
Here we show the covariance matrix of the model parameters.
In [30]:
my_project.plot_covariance()
In [31]:
#my_project.interpret_model()
print(my_project.interpret_model())
Parameter name                   Value   Uncert  FactVal FactUnc NewVal  Uncert
Parameter 1                    :       1    2.72   -0.74    0.25    0.48    1.29
Parameter 2                    :       1    2.72    0.26    0.55     1.3    1.74
Parameter 3                    :       1    2.72    0.57    0.37     1.8    1.45
Parameter 5                    :       1    2.72   -0.17    0.83    0.84    2.29
Parameter 7                    :       1    2.72    0.36    0.92     1.4    2.52
In [32]:
print(my_project.print_model_values())
Parameter name                   Value   Uncert
Parameter 1                    :       1    2.72
Parameter 2                    :       1    2.72
Parameter 3                    :       1    2.72
Parameter 5                    :       1    2.72
Parameter 7                    :       1    2.72
In [33]:
print(my_project.validate_solution())
Name                  Value  Unc    OptVal OptUnc MdlVal MdlUnc
Experiment 2        :   0.25   0.05   0.24   0.05  -0.60   0.62
Experiment 3        :   0.20   0.05   0.21   0.05   0.50   0.62
Experiment 4        :   0.70   0.08   0.70   0.08   0.80   0.62
Application 1       :   0.00   0.00  -0.68   0.11   0.00   0.51
Experiment 1        :   0.40   0.05  -0.15   0.09   0.20   0.62
Experiment 5        :   0.40   0.80   1.11   0.34   0.50   0.62
In [34]:
print(my_project)
project
6 measurements
Experiment 2 (Active): 1
Experiment 3 (Active): 2
Experiment 4 (Active): 3
Application 1 (Application): 0
Experiment 1 (Inconsistent): 0
Experiment 5 (Low Information): 4

Name                  Value  Unc    OptVal OptUnc MdlVal MdlUnc
Experiment 2        :   0.25   0.05   0.24   0.05  -0.60   0.62
Experiment 3        :   0.20   0.05   0.21   0.05   0.50   0.62
Experiment 4        :   0.70   0.08   0.70   0.08   0.80   0.62
Application 1       :   0.00   0.00  -0.68   0.11   0.00   0.51
Experiment 1        :   0.40   0.05  -0.15   0.09   0.20   0.62
Experiment 5        :   0.40   0.80   1.11   0.34   0.50   0.62

Parameter name                   Value   Uncert  FactVal FactUnc NewVal  Uncert
Parameter 1                    :       1    2.72   -0.74    0.25    0.48    1.29
Parameter 2                    :       1    2.72    0.26    0.55     1.3    1.74
Parameter 3                    :       1    2.72    0.57    0.37     1.8    1.45
Parameter 5                    :       1    2.72   -0.17    0.83    0.84    2.29
Parameter 7                    :       1    2.72    0.36    0.92     1.4    2.52
In [36]:
print(my_project.interpret_model())
Parameter name                   Value   Uncert  FactVal FactUnc NewVal  Uncert
Parameter 1                    :       1    2.72   -0.74    0.25    0.48    1.29
Parameter 2                    :       1    2.72    0.26    0.55     1.3    1.74
Parameter 3                    :       1    2.72    0.57    0.37     1.8    1.45
Parameter 5                    :       1    2.72   -0.17    0.83    0.84    2.29
Parameter 7                    :       1    2.72    0.36    0.92     1.4    2.52
In [45]:
def interpret_model_as_arrays(project,measurement=0):
    '''Takes a project and returns the model parameter values and uncertainties as arrays

    :param project: The MUM-PCE project whose parameters are being identified
    :type project: MUM-PCE Project
    :key measurement: A measurement identifier, either int or string
    :returns: The new model parameter values and new uncertainties as NumPy arrays
    '''
    meas = project[measurement]

    print(meas)

    x = project.solution.x
    cov = project.solution.cov

    new_values = []
    new_uncertainties = []

    for active_num,param in enumerate(meas.active_parameters):
        value = meas.model.get_parameter(param)
        this_x = x[active_num]
        this_std = 2*np.sqrt(cov[active_num,active_num])
        this_unc = meas.parameter_uncertainties[active_num]

        multiplier = this_unc ** this_x
        new_value = value*multiplier
        new_uncertainty = this_unc ** (this_std)

        new_values += [new_value]
        new_uncertainties += [new_uncertainty]
    new_values = np.array(new_values)
    new_uncertainties = np.array(new_uncertainties)

    return new_values,new_uncertainties
In [46]:
interpret_model_as_arrays(my_project)
Experiment 2 (Active): 1
Out[46]:
(array([ 0.47803445,  1.29799983,  1.76326957,  0.84261713,  1.43934579]),
 array([ 1.28524602,  1.73639604,  1.45217576,  2.29051459,  2.51677464]))
In [ ]: