Detection Limits of AI Segmentation Models Applied to Scanning Electron Microscopy (SEM) Image-Based Detection:
More information about the evaluations of detection limits can be found in the papers
(1) Peter Bajcsy, Brycie Wiseman, Michael Majurski, and Andras Vladar,
�Detection limits of AI-based SEM dimensional metrology,�
Proceedings of SPIE conference on Advanced Lithography + Patterning,
23 - 27 February 2025, San Jose, California, US,
Program: URL.
(2) Peter Bajcsy, Pushkar Sathe, and Andras Vladar,
�Relating human and AI-based detection limits in SEM dimensional metrology,�
(under review)
Interactive access to 540 visualization graphs below:
Click on the Metric Category drop-down menu (Select Category space) to select one of the options
(Data Quality, AI Model, Detection Limits, AI to SNR Mapping).
Repeat selections for another drop-down menu that always appears below according to the previously selected item.
After all (two or three selections) have been made, click on the Request Visualization button.
To learn about the definitions of all metrics, click on the Explain Metrics button.
Select Visualization of Metrics
Estimate refers to data-driven estimation of all parameters needed for a metric calculation.
Param refers to using the simulation noise parameter when computing a metric.
Aceessible Measurements
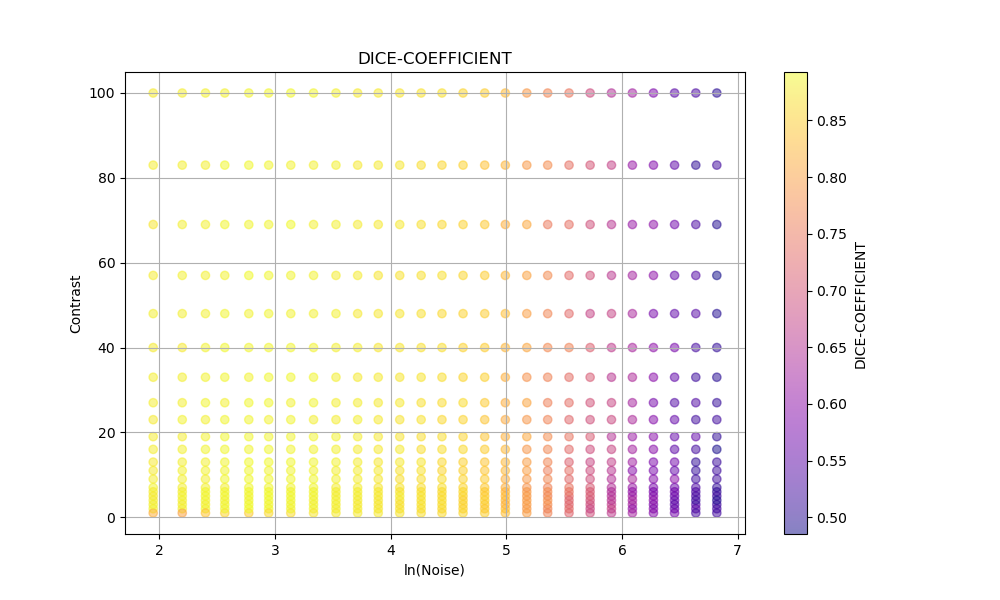
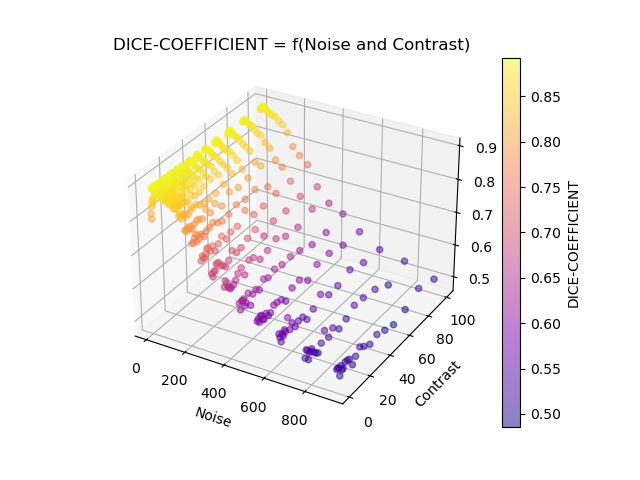
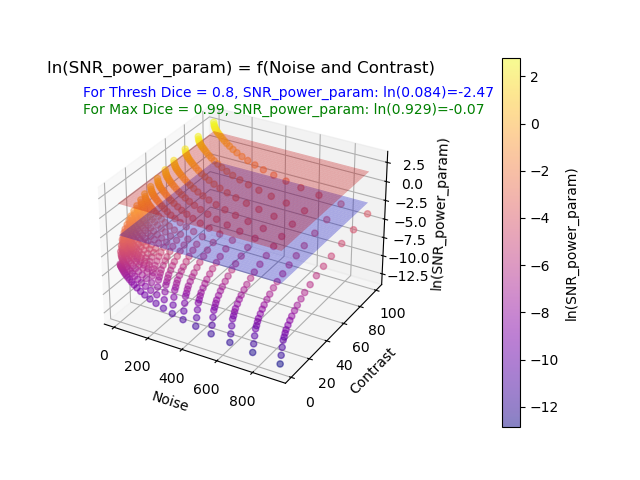
After selecting the configuration of metric visualization above, a user can explore 2D scatter or 3D surface plots
of image data quality metrics, AI model accuracy metrics, and the relationships of detection limits by human and numerical
observers based on their detection confidence. All metrics are visualized as a function of noise and contract properties.
To explore the characteristics of training images and trained AI models, we generated a total of 540 graphs:
171 2D scatter plots for 25 image quality metrics times 6 image sets + 7 AI model accuracy metrics times 3 trained AI models
171 3D surface plots for the same configurations as in the case of 2D scatter plots
99 3D surface plots for ten SNR image quality metrics times 3 AI model accuracy metrics times 3 trained AI models
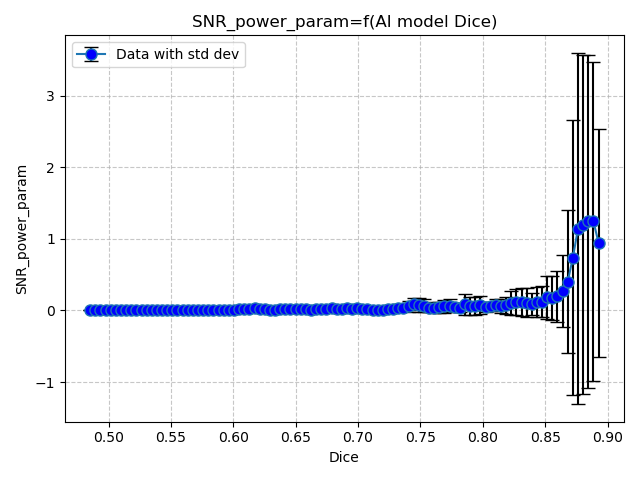
99 line graphs for the mappings between 3 AI model accuracy metrics and 10 SNR image quality metrics times 3 trained AI models.
Figure 1 shows an example of the 2D and 3D visualizations via the web interactive interface.
Illustration of the types of visualizations
Components:
The accessible visualizations have been created from 6 simulated image datasets
(each 567 images of varying noise and contrast quality, 512 x 512 pixels)
and 3 trained UNet AI models (~7.9 million parameters).
The simulated images were created by using the ARTIMAGEN SEM simulation software:
Petr Cizmar, Andr�s E. Vlad�r, Michael T. Postek, "Optimization of accurate SEM imaging by use of artificial images," Proc. SPIE 7378, Scanning Microscopy 2009, 737815 (22 May 2009); https://doi.org/10.1117/12.823415
The execution and full computational provenance were obtained by using the WIPP scientific workflow software:
GitHub: WIPP code.
Bajcsy, P. , Chalfoun, J. and Simon, M. (2018), Web Microanalysis of Big Image Data, Springer International Publishing