HITRAN Line-by-Line Static Molecules
Provided in the MATS are several examples highlighting MATS capabilities, which can be found in the MATS examples folder.
MATS has added the capability to simulate and/or fit spectra of molecules that only available in HITRAN as static molecules (not in the typical HITRANOnline) format.
Generating a MATS linelist from a .par file
The .par formatting is provided in Table 1 of the HITRAN 2004 paper. The code below uses that .par formatting to parse the spectra into the MATS format.
L.S. Rothman, D. Jacquemart, A. Barbe, D. Chris Benner, M. Birk, L.R. Brown, M.R. Carleer, C. Chackerian, K. Chance, L.H. Coudert, V. Dana, V.M. Devi, J.-M. Flaud, R.R. Gamache, A. Goldman, J.-M. Hartmann, K.W. Jucks, A.G. Maki, J.-Y. Mandin, S.T. Massie, J. Orphal, A. Perrin, C.P. Rinsland, M.A.H. Smith, J. Tennyson, R.N. Tolchenov, R.A. Toth, J. Vander Auwera, P. Varanasi, G. Wagner, The HITRAN 2004 molecular spectroscopic database, Journal of Quantitative Spectroscopy and Radiative Transfer, Volume 96, Issue 2, 2005, Pages 139-204, https://doi.org/10.1016/j.jqsrt.2004.10.008
Users will need to download the .par file provided by HITRAN for desired molecule.
This example uses CF4 and a portion of the HITRAN provided .par file. The entire HITRAN .par file can be used (and has been tested locally), but is above the github file storage recommendation.
molecule = 'CF4'
filename = '42_hit20_500_800.par'
PARAM_LINELIST = pd.DataFrame()
with open(filename) as file:
PARAM_LINELIST['molec_id'] = [int(line[0:2]) for line in file]
with open(filename) as file:
PARAM_LINELIST['local_iso_id'] = [int(line[2:3]) for line in file]
with open(filename) as file:
PARAM_LINELIST['nu'] = [float(line[3:15]) for line in file]
with open(filename) as file:
PARAM_LINELIST['sw'] = [float(line[15:25]) for line in file]
with open(filename) as file:
PARAM_LINELIST['elower'] = [ float(line[45:55]) for line in file]
with open(filename) as file:
PARAM_LINELIST['gamma0_air'] = [ float(line[35:40]) for line in file]
with open(filename) as file:
PARAM_LINELIST['n_gamma0_air'] = [ float(line[55:59]) for line in file]
with open(filename) as file:
PARAM_LINELIST['delta0_air'] = [ float(line[59:67]) for line in file]
with open(filename) as file:
PARAM_LINELIST['gamma0_self'] = [ float(line[40:45]) for line in file]
PARAM_LINELIST['delta0_self'] = PARAM_LINELIST['delta0_air'].values
PARAM_LINELIST['n_gamma0_self'] = PARAM_LINELIST['n_gamma0_air'].values
PARAM_LINELIST['n_delta0_air'] = 0
PARAM_LINELIST['n_delta0_self'] = 0
PARAM_LINELIST['SD_gamma_air'] = 0
PARAM_LINELIST['SD_gamma_self'] = 0
PARAM_LINELIST['n_gamma2_air'] = PARAM_LINELIST['n_gamma0_air'].values
PARAM_LINELIST['n_gamma2_self'] = PARAM_LINELIST['n_gamma0_self'].values
PARAM_LINELIST['SD_delta_air'] = 0
PARAM_LINELIST['SD_delta_self'] = 0
PARAM_LINELIST['n_delta2_air'] = 0
PARAM_LINELIST['n_delta2_self'] = 0
PARAM_LINELIST['nuVC_air'] = 0
PARAM_LINELIST['nuVC_self'] = 0
PARAM_LINELIST['n_nuVC_air'] = 1
PARAM_LINELIST['n_nuVC_self'] = 1
PARAM_LINELIST['eta_air'] = 0
PARAM_LINELIST['eta_self'] = 0
PARAM_LINELIST['y_air'] = 0
PARAM_LINELIST['y_self'] = 0
PARAM_LINELIST['n_y_air'] = 1 #used in MATS versions 3 (current development version) and higher
PARAM_LINELIST['n_y_self'] = 1#used in MATS versions 3 (current development version) and higher
PARAM_LINELIST = PARAM_LINELIST[['molec_id', 'local_iso_id', 'nu', 'elower', 'sw',
'gamma0_air', 'n_gamma0_air', 'delta0_air', 'n_delta0_air',
'SD_gamma_air', 'n_gamma2_air', 'SD_delta_air', 'n_delta2_air',
'nuVC_air', 'n_nuVC_air', 'eta_air', 'y_air', 'n_y_air',
'gamma0_self', 'n_gamma0_self', 'delta0_self', 'n_delta0_self',
'SD_gamma_self', 'n_gamma2_self', 'SD_delta_self', 'n_delta2_self',
'nuVC_self', 'n_nuVC_self', 'eta_self', 'y_self', 'n_y_self',]]
PARAM_LINELIST.sort_values(by = ['nu'], inplace = True)
#PARAM_LINELIST.to_csv(molecule + '_ParameterLinelist.csv', index = False) #Can save to .csv file, but it is a large file, so you might want to truncate before saving
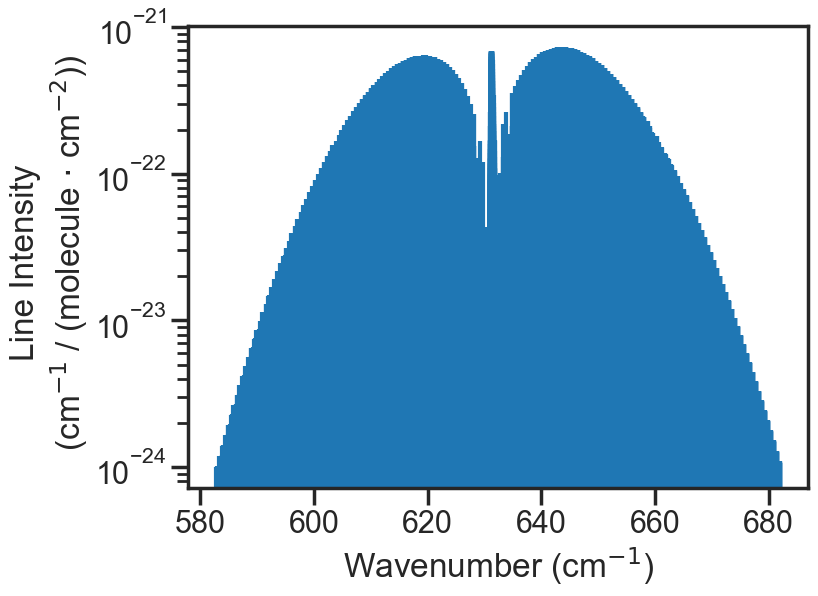
plt.figure(figsize=(8, 6))
plt.stem(PARAM_LINELIST['nu'], PARAM_LINELIST['sw'], use_line_collection = True, markerfmt = " ")
plt.yscale('log')
plt.xlabel('Wavenumber (cm$^{-1}$)')
plt.ylabel('Line Intensity \n (cm$^{-1}$ / (molecule $\cdot$ cm$^{-2}$))')
TIPS Availability
While these molecules are available in HITRAN, the molecules available in the TIPS-2011 and TIPS-2017 partition function libraries differ. For example in hapi TIPS-2011 has information for CF4, where TIPS-2017 is an array of zeros. This leads to nan values for the at simulation temperature line intensities. We added the MATS capability to switch from the default TIPS-2017 to TIPS-2011, so that this molecule could be appropriately simulated. Below is a summary of molecules, where this might be an issue. For molecules with no TIPS available the TIPS call with through an error and the 296 line intensity will be used.
TIPS 2011 Only
SO3, M = 46, I =1 CF4, M = 42, I = 1 No TIPS data
HNO3, M = 12, I = 2 HF, M = 14, I = 2 HCl, M = 15, I = 3, 4 HBr, M = 16, I = 3, 4 HI, M = 17, I = 2 N2, M = 22, I = 2 COF2, M = 29, I = 2 O, M = 34, I = 1 CH3OH, M = 38, I=1
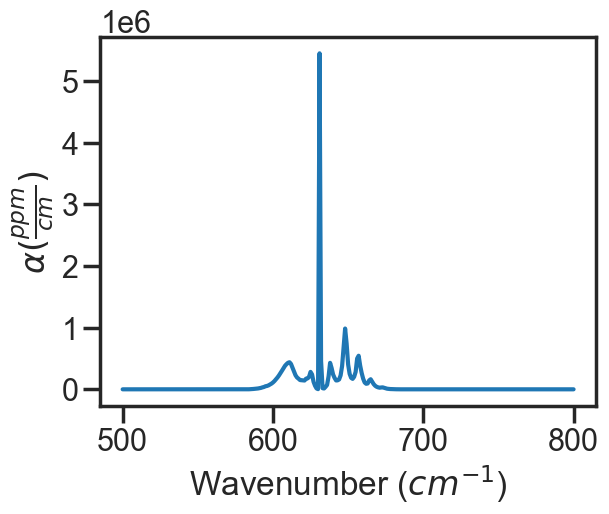
Simulating in MATS
Once the MATS linelist file has been generated spectra can be simulated or fit in MATS as normal.
#PARAM_LINELIST = pd.read_csv('CF4_ParameterLinelist.csv') # Option to read in so you don't have to generate the file every time


wave_range = 1.5 #range outside of experimental x-range to simulate
IntensityThreshold = 1e-30 #intensities must be above this value to be simulated
Fit_Intensity = 1e-24 #intensities must be above this value for the line to be fit
order_baseline_fit = 1
baseline_terms = [0] #polynomial baseline coefficients where the index is equal to the coefficient order

sample_molefraction = {42 :1} #The number here is the molec_id number can be found https://hitran.org/docs/iso-meta/
wave_min = 500 #cm-1
wave_max = 800 #cm-1
wave_space = 1 #cm-1
SNR = None #if None, then infinite SNR
temperature = 22.85 # celsius
pressure = 760 #torr
spectrum_filename = 'Simulate_CF4'

spec_1 =  MATS.simulate_spectrum(PARAM_LINELIST, wave_min = wave_min, wave_max = wave_max, wave_space = wave_space,
                                                SNR = SNR, baseline_terms = baseline_terms, temperature = temperature, pressure = pressure,
                                                wing_cutoff = 5,  wing_method = 'wing_cutoff',
                                                filename = spectrum_filename, molefraction = sample_molefraction,TIPS = PYTIPS2011)

spec_1.plot_wave_alpha()