Lineage Mapper

An open source, highly accuracy,
overlap-based cell tracking system.


What is Lineage-Mapper?

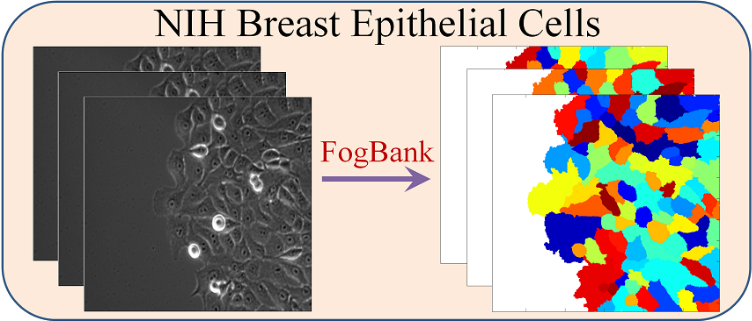
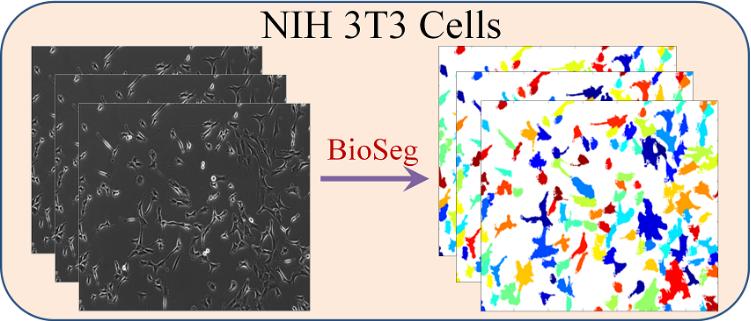
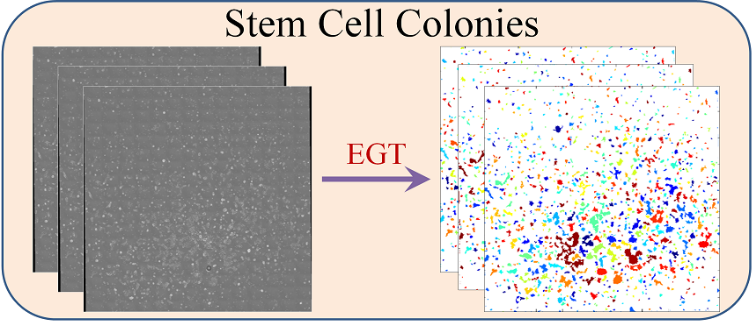
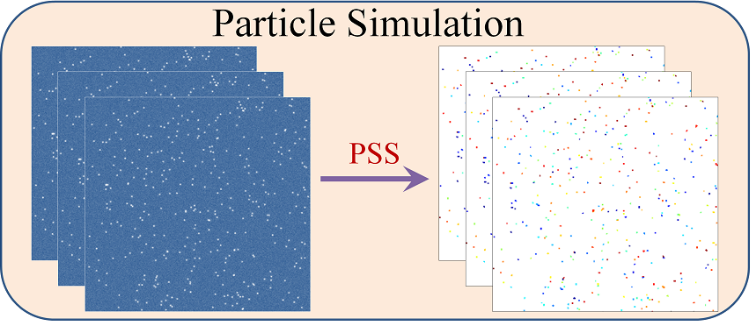
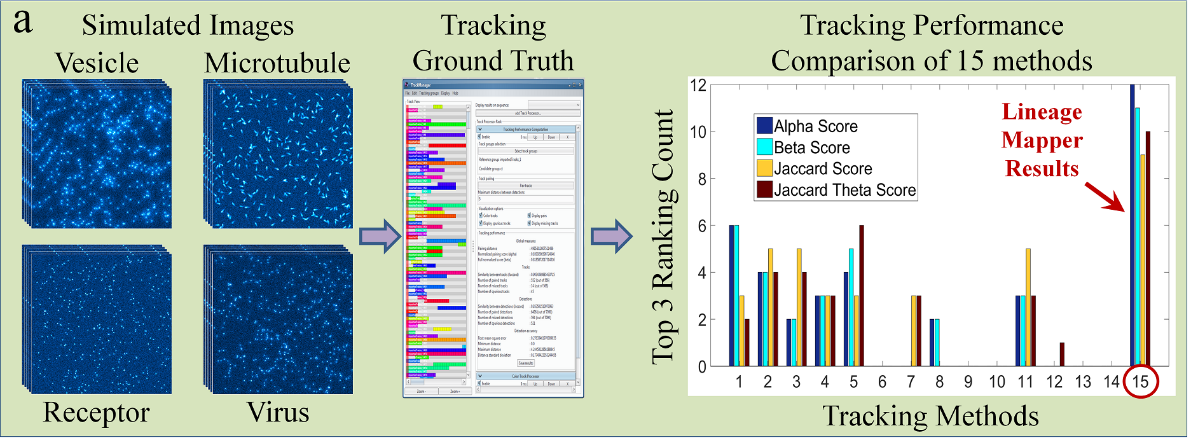
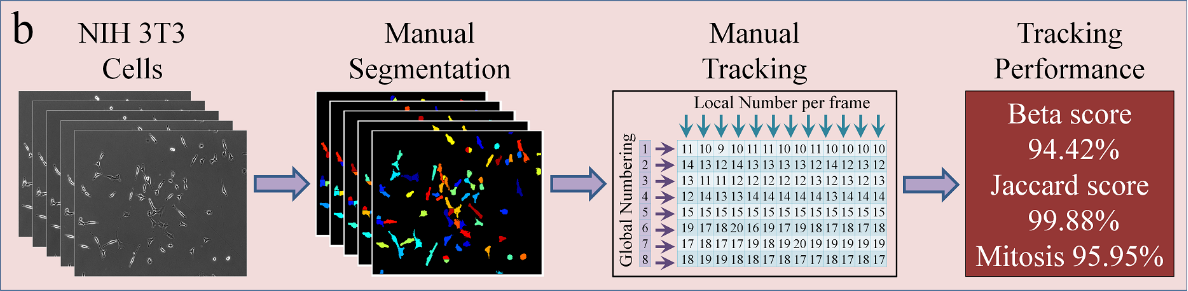
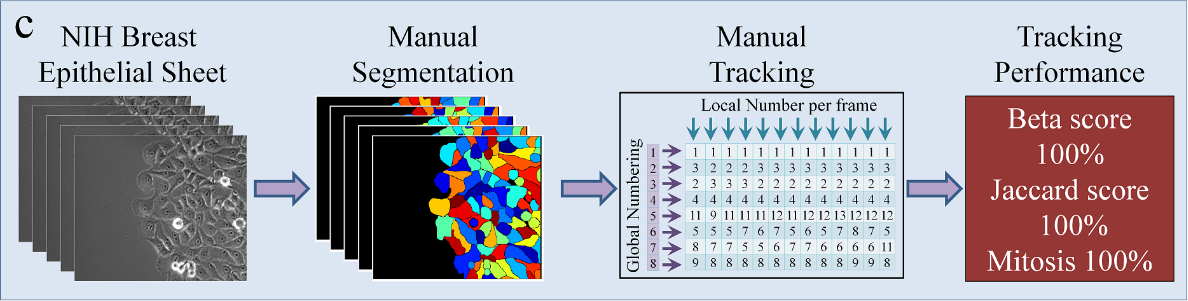
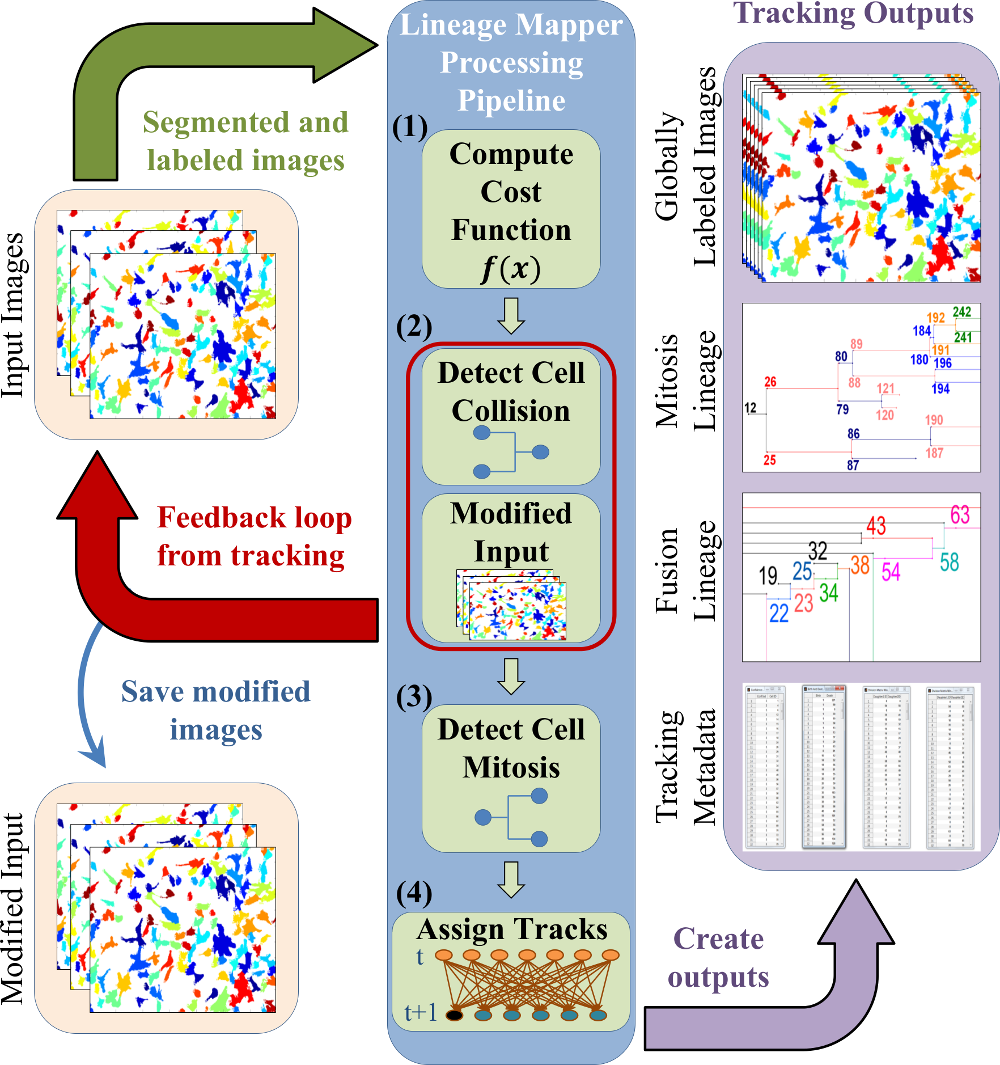
Lineage Mapper is an open-source, highly accurate, overlap-based cell tracking system for time-lapse images of biological cells, colonies, and particles. Lineage Mapper tracks objects independently of the segmentation method, detects mitosis in confluence, separates cell clumps mistakenly segmented as a single cell, provides accuracy and scalability even on terabyte-sized datasets, and creates division and/or fusion lineages. Lineage Mapper has been tested and validated on multiple biological and simulated problems.


Tracking Pipeline
Lineage Mapper processing pipeline and tracking outputs. The algorithmic steps consists of: (1) compute cost between cells from consecutive frames, (2) detect cell collision and account for it, (3) detect mitosis events, (4) assign tracks between cells, and (5) create tracking outputs. The outputs includes saved tracked images, the cell lineage plotting and 4 tracking output measurements: confidence index, the birth and death matrix, the mitosis matrix, and the fusion matrix.

Publications:

J. Chalfoun, M. Majurski, A. Dima, M. Halter, K. Bhadriraju, and M. Brady, “Lineage mapper: A versatile cell and particle tracker,” Scientific Reports, vol. 6, October, 2016, DOI: 10.1038/srep36984
(view article)

J. Chalfoun, A. Cardone, and A. Dima, “Overlap-based cell tracker,” J. Research Natl. Inst. Stand. Technol., vol. 115, no. 6, p. 477, Nov. 2010
(download pdf) (view article)

Features

Tracking Evaluation Data

Lineage Mapper has been applied on three time-lapse cell image experiments as well as on publicly available datasets of simulated particles in motion. Each dataset was segmented using a different segmentation method.

Tracking Dataset: NIH MCF10A Breast Epithelial Cells

NIH MCF10A Breast Epithelial Cells - we tracked these cells which are connected together and move as a sheet, a situation that is commonly encountered with epithelial cells and is of interest for understanding mechanisms of sheet-like cell migration observed during development and migration of some cancer cells.

Tracking Dataset: NIH 3T3 Cells

NIH 3T3 Cells - we tracked these cells to examine the dynamic regulation of tenascin-C promoter activity. Tenascin-C protein plays a critical role in development, wound healing, and cancer progression. NIH 3T3 is a fibroblast-like cell line where there is predominantly single cell migration with frequent shape changes and collisions between moving cells.

Tracking Dataset: Stem Cell Colonies (H9 hESC)

Stem Cell Colonies (H9 hESC) - these cells form colonies of pluripotent stem cells which move, grow, and fuse. Pluripotent stem cells exist in a privileged developmental state with the potential to form any of the cell types of the adult body. These cells grow as isolated colonies, with each colony consisting of tens to thousands of cells. There is an interest in tracking these colonies to understand the temporal relation between gene expression and cell state, in order to potentially engineer the cell state for regenerative medicine applications.

Tracking Dataset: Particle Simulation

Particle Simulation - we tracked a publicly available simulated dataset of particles in motion. This dataset includes three particle densities (low, medium, and high) for 100 time lapse images of 4 particle motion scenarios: vesicles, microtubules, receptor, and viruses for a total of 12 simulated datasets.

Tracking Accuracy

Cell and particle tracking performance of Lineage Mapper on real and simulated datasets. (a) Tracking accuracy measured on 12 simulated reference datasets for performance quantification and comparison between 15 trackers. (b,c) Tracking accuracy measured on manual segmentation and tracking of two randomly chosen time-lapse images of NIH 3T3 fibroblast cells and MCF10A breast epithelial sheets respectively.

Tracking Accuracy: Particle Simulation

Particle Simulation - LM tracking performance is compared against 14 existing particle tracking tools (a). The accuracy of any tracking method was computed using four metrics: Alpha, Beta, Jaccard, and Jaccard Theta. The summary of the accuracy results is reported by the number of times a particular method ranked among the top 3 positions for a given scoring metric across all 12 datasets. This analysis measures the robustness of a tracking technique across multiple particle motion scenarios and scoring metrics. LM performed well amongst the tested particle tracking methods (a) and scored in the top three: 12/12 with the Alpha score, 11/12 with the Beta score, 9/12 with the Jaccard score, and 10/12 with the Jaccard Theta score.

Tracking Accuracy: NIH 3T3

NIH 3T3 - one randomly chosen NIH 3T3 fibroblast experiment (238 frames, 8091 tracking decisions, and 148 mitosis events) was manually segmented and tracked by expert scientists. Both manual segmentations and tracking data were inspected by a second expert to reduce human errors. LM tracking and mitosis detection accuracies measured 100% (c) on this biological datasets.

Tracking Accuracy: NIH MCF10A Breast Epithelial

NIH MCF10A Breast Epithelial - one randomly chosen MCF10A breast epithelial cell sheets time-sequence (59 frames, 5722 tracking decisions, and 6 mitosis events) was manually segmented and tracked by expert scientists. Both manual segmentations and tracking data were inspected by a second expert to reduce human errors. LM tracking and mitosis detection accuracies measured between 94.42% and 98.88% (b) on this biological datasets.

License

NIST-developed software is provided by NIST as a public service. You may use, copy and distribute copies of the software in any medium, provided that you keep intact this entire notice. You may improve, modify and create derivative works of the software or any portion of the software, and you may copy and distribute such modifications or works. Modified works should carry a notice stating that you changed the software and should note the date and nature of any such change. Please explicitly acknowledge the National Institute of Standards and Technology as the source of the software.

NIST-developed software is expressly provided "AS IS." NIST MAKES NO WARRANTY OF ANY KIND, EXPRESS, IMPLIED, IN FACT OR ARISING BY OPERATION OF LAW, INCLUDING, WITHOUT LIMITATION, THE IMPLIED WARRANTY OF MERCHANTABILITY, FITNESS FOR A PARTICULAR PURPOSE, NON-INFRINGEMENT AND DATA ACCURACY. NIST NEITHER REPRESENTS NOR WARRANTS THAT THE OPERATION OF THE SOFTWARE WILL BE UNINTERRUPTED OR ERROR-FREE, OR THAT ANY DEFECTS WILL BE CORRECTED. NIST DOES NOT WARRANT OR MAKE ANY REPRESENTATIONS REGARDING THE USE OF THE SOFTWARE OR THE RESULTS THEREOF, INCLUDING BUT NOT LIMITED TO THE CORRECTNESS, ACCURACY, RELIABILITY, OR USEFULNESS OF THE SOFTWARE.

You are solely responsible for determining the appropriateness of using and distributing the software and you assume all risks associated with its use, including but not limited to the risks and costs of program errors, compliance with applicable laws, damage to or loss of data, programs or equipment, and the unavailability or interruption of operation. This software is not intended to be used in any situation where a failure could cause risk of injury or damage to property. The software developed by NIST employees is not subject to copyright protection within the United States.

Contact

We hope you enjoy Lineage-Mapper and its functionality.
If you have any suggestions or comments please feel free to send us an email.

Get Connected