Using the Pipeline Builder App#
The Pipeline Builder is a web-based graphical user interface for creating, editing, and managing data processing pipelines in AFL. This interactive tool allows you to drag and drop pipeline operations, connect them visually, and configure their parameters through an intuitive interface.
Overview#
The Pipeline Builder provides a visual way to construct complex data processing workflows without writing code. Key features include:
Drag-and-drop interface: Add operations by dragging from the sidebar
Visual connections: Connect operations by drawing lines between input and output connectors
Parameter editing: Configure operation parameters through a dedicated pane
Prefab templates: Load and save pre-built pipeline templates
Real-time validation: Automatic connectivity analysis and error checking
Export functionality: Generate pipeline JSON for use in code
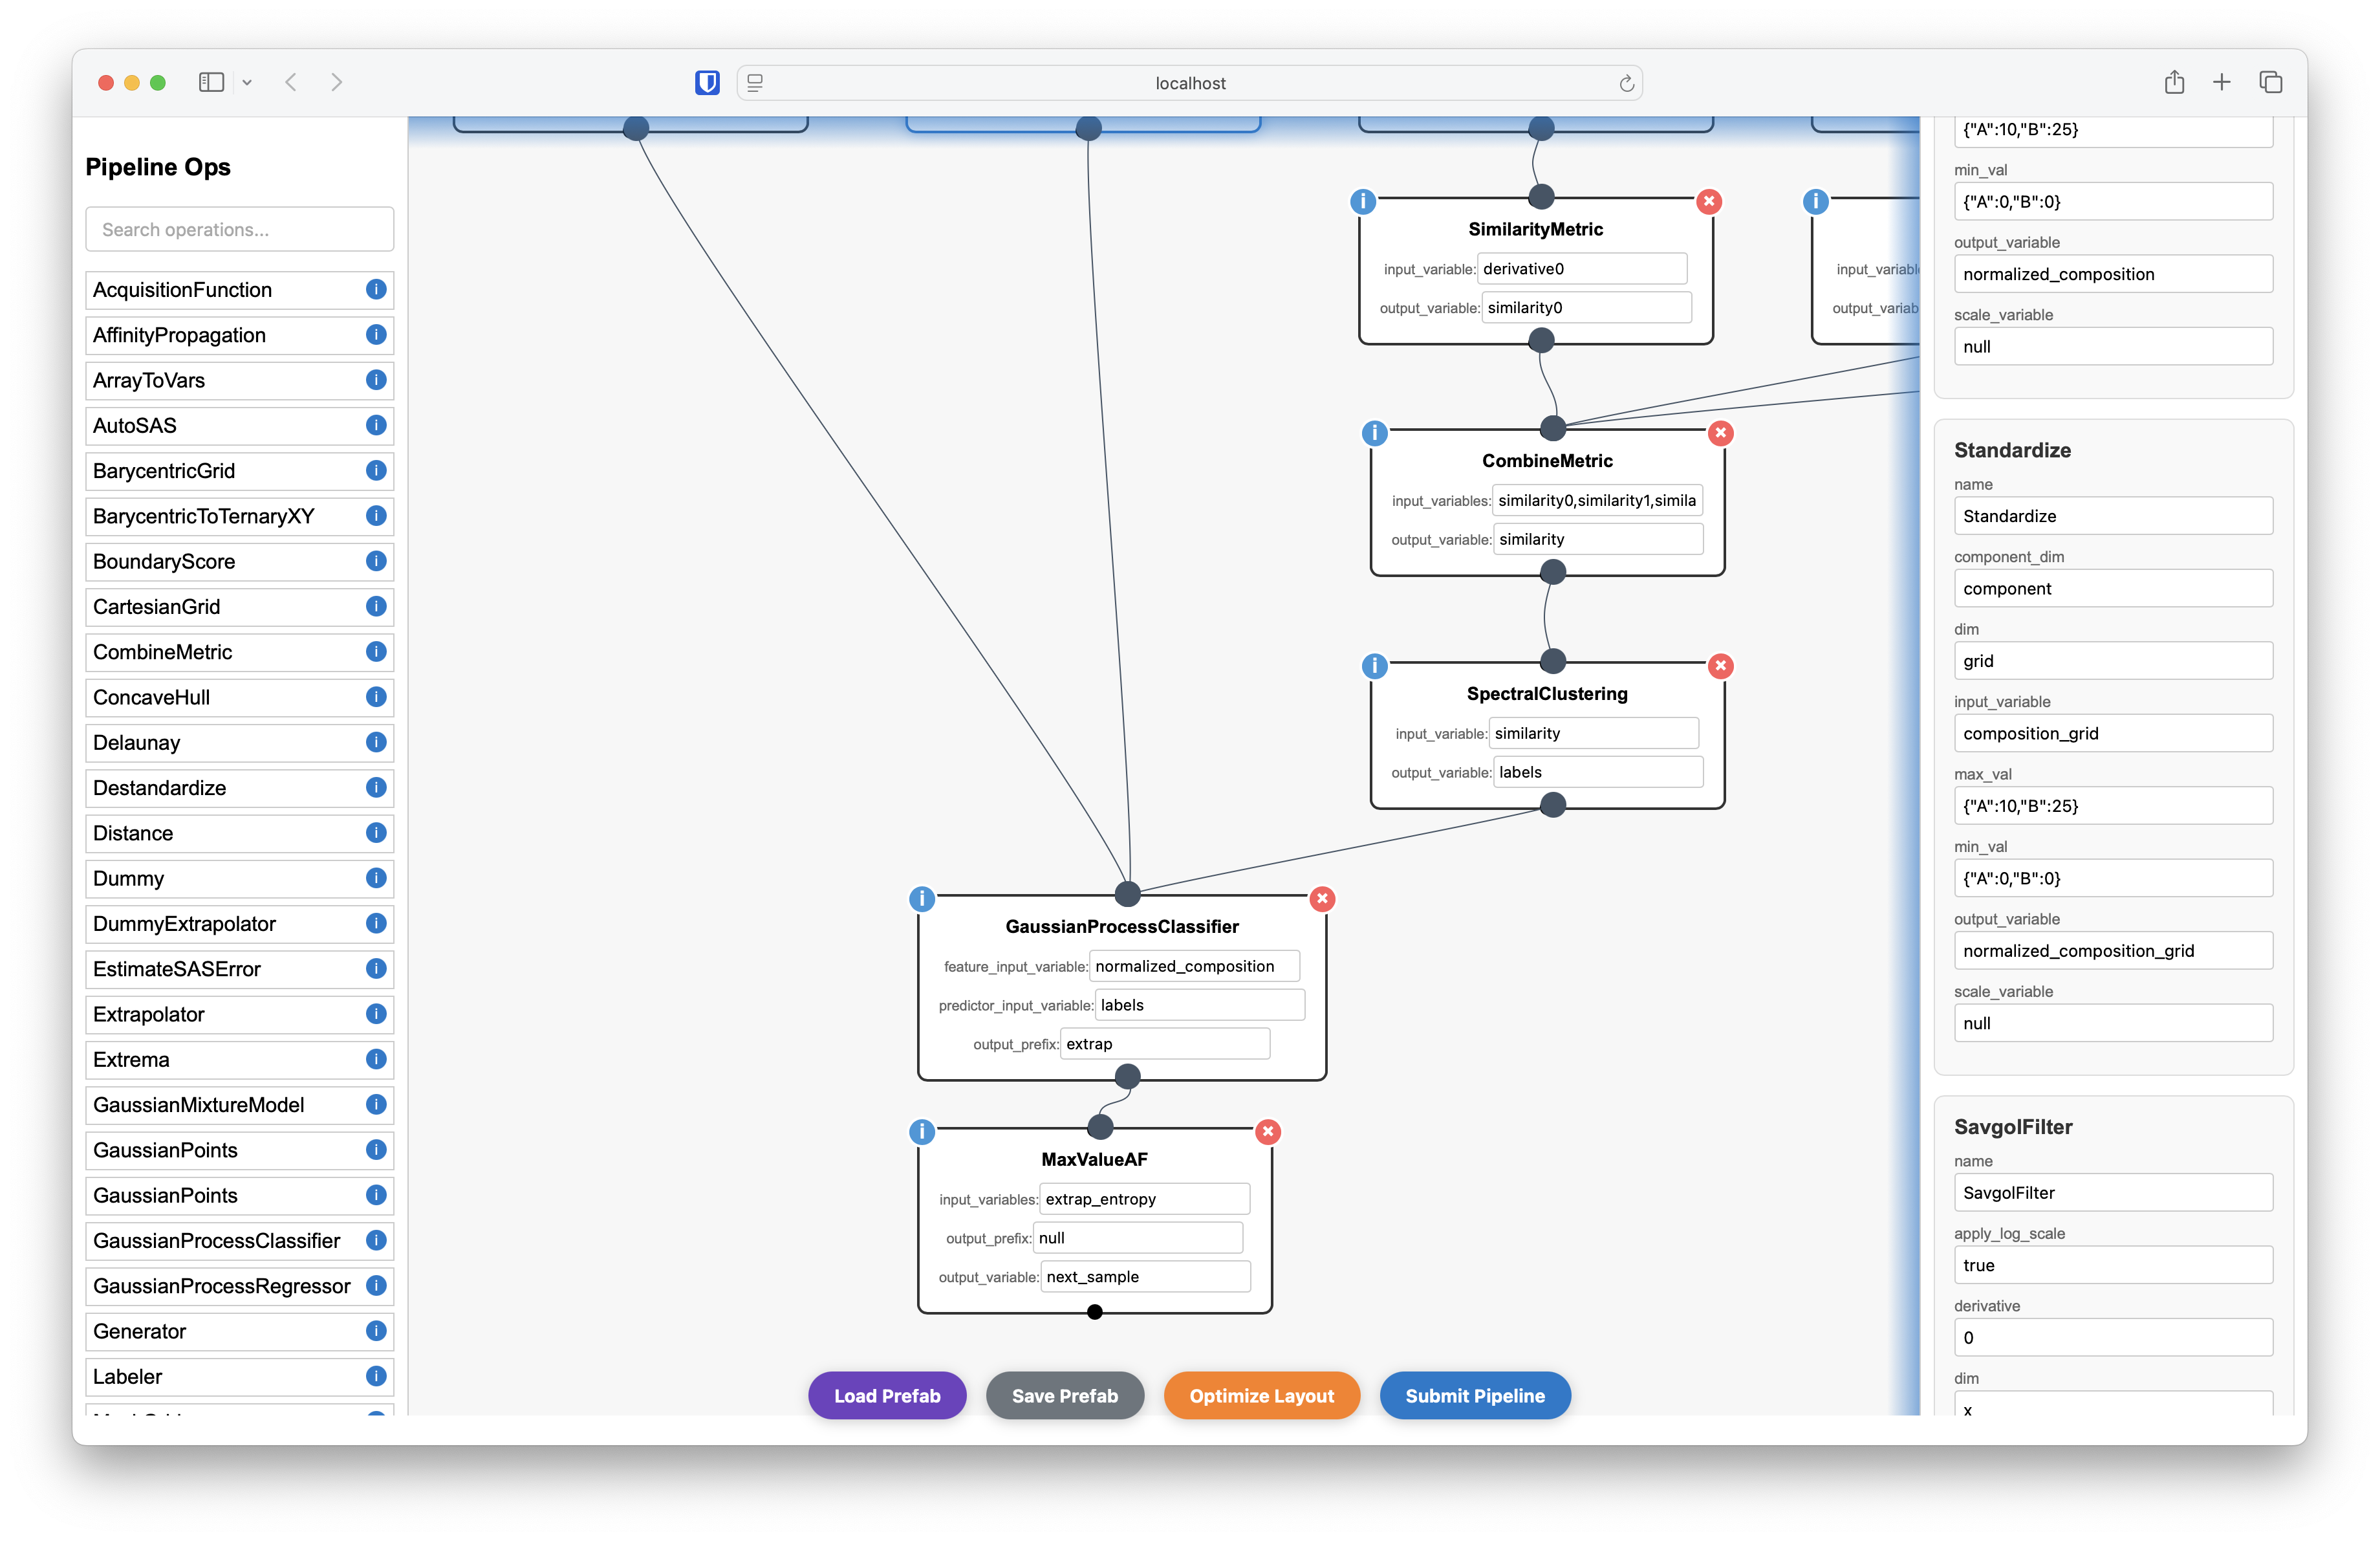
The Pipeline Builder interface showing the main components: operation sidebar (left), canvas (center), and parameter pane (right)#
Launching the Pipeline Builder#
The Pipeline Builder is accessed through the DoubleAgentDriver APIServer. Follow these steps to launch it:
Step 1: Start the DoubleAgentDriver APIServer#
First, you need to have a running DoubleAgentDriver APIServer. You can start one programmatically:
python -m AFL.double_agent.AgentDriver
or by using the AFL-andon application
Step 2: Access the Web Interface#
Once the server is running, open your web browser and navigate to the server URL (typically http://localhost:5051). You’ll see the APIServer web interface.
Step 3: Open the Pipeline Builder#
In the APIServer web interface, you’ll find a “Pipeline Builder” link in the useful links section. Click this link to open the Pipeline Builder application in a new tab or window.
Alternatively, you can access it directly at: http://localhost:5051/pipeline_builder
Interface Components#
The Pipeline Builder interface consists of three main areas:
2. Canvas (Center)#
The main canvas is where you build your pipeline by:
Dragging operations from the sidebar
Positioning them visually
Drawing connections between operations
Selecting operations for parameter editing
3. Parameters Pane (Right)#
The right pane shows detailed parameters for the currently selected operation, allowing you to:
Edit operation parameters
Configure input/output variable names
View operation documentation
Building Your First Pipeline#
Let’s walk through creating a simple data processing pipeline:
Step 1: Add Operations#
Drag an operation from the sidebar to the canvas
Position it where you want it in your workflow
Repeat for additional operations
Step 2: Connect Operations#
Operations have input (top) and output (bottom) connectors:
Click and drag from an output connector (bottom circle) of one operation
Drag to an input connector (top circle) of another operation
Release to create the connection
The system will automatically match operations based on variable names.
Step 3: Configure Parameters#
Click on an operation to select it (it will be highlighted in blue)
View parameters in the right pane
Edit values as needed for your use case
Set variable names to control data flow between operations
Key Features and Tools#
Operation Management#
Delete: Click the red ‘X’ button on any operation to remove it
Move: Drag operations around the canvas to reorganize
Duplicate: Copy and paste operations to create duplicates
Working with Prefabs#
Prefabs are pre-built pipeline templates that can save time for common workflows:
Loading a Prefab#
Click “Load Prefab” button at the bottom
Select from available prefab templates
Confirm to load the prefab onto the canvas
The prefab will be loaded with all operations and connections pre-configured.
Saving a Prefab#
Build your pipeline on the canvas
Click “Submit” and choose the save option
Enter a name for your prefab
Confirm to save it for future use
Exporting and Using Pipelines#
Once you’ve built your pipeline in the visual interface, you can export it for use in your code:
Export Pipeline JSON#
Complete your pipeline design
Click “Submit” at the bottom
Copy the generated JSON from the output
Tips and Best Practices#
Variable Naming#
Use descriptive names for variables to make connections clear
Be consistent with naming conventions across operations
Match output variables of one operation to input variables of the next
Conclusion#
The Pipeline Builder provides a powerful visual interface for creating data processing workflows in AFL. By combining drag-and-drop simplicity with the full power of AFL’s pipeline operations, it enables both beginners and experts to rapidly prototype and deploy complex data analysis pipelines.
For more advanced pipeline development, see the other how-to guides in this documentation, including: